
Monitoring the Kubernetes Nginx Ingress Controller with Prometheus and Grafana
In a previous article I explained how we can set-up an Nginx Kubernetes Ingress Controller, but how can we now monitor this? This is what I would like to tackle in this article, on how we are able to utilize Prometheus and Grafana to start visualizing what is happening on our Ingress Controller.
Prerequisites
After following my previous article you will now have the following components running:
- An Nginx Ingress controller deployed in the
ingress-nginxnamespace - A demo application that we can reach through a
ingressroute
If you do not have these 2 components running, I would recommend you to go check it out!
Setting up Prometheus
When we open the reference of ingress-nginx online we can see that it should be quite straightforward to install prometheus.
Simply run the following to deploy and configure the Prometheus Server:
kubectl apply --kustomize github.com/kubernetes/ingress-nginx/deploy/prometheus/
Once this is done (~2 min) you will see some output of everything that was created:
serviceaccount/prometheus-server created
role.rbac.authorization.k8s.io/prometheus-server created
rolebinding.rbac.authorization.k8s.io/prometheus-server created
configmap/prometheus-configuration-hct76d4c56 created
service/prometheus-server created
deployment.apps/prometheus-server created
Now on to the "hard" part - reconfiguring our Nginx.
Note: at the time of writing (20-SEP-2020) the documentation was incomplete, making me spend 5h on the issue of reconfiguring nginx…
Reconfiguring Nginx
Reconfiguring Nginx to allow metrics to be sent to Prometheus might sound as an easy task, but actually it isn't… It appears that the official documentation is lacking on this point and that a recent pull request requires the ServiceMonitor to be used.
Installing the ServiceMonitor is a good option, but when checking this on the official repository it shows that this is still in "Beta" so it's not a really a good option to configure this one.
Luckily for us we can always check the values defined in our helm chart, which shows that we can still utilize the prometheus annotations.
Therefor we upgrade our Helm chart through the following command:
helm upgrade ingress-controller ingress-nginx/ingress-nginx \
  --namespace ingress-nginx \
  --set controller.metrics.enabled=true \
  --set-string controller.podAnnotations."prometheus\.io/scrape"="true" \
  --set-string controller.podAnnotations."prometheus\.io/port"="10254"
When we validate this through the following command
helm get values ingress-controller --namespace ingress-nginx
We can see that our values are now set as they should:
controller:
  metrics:
    enabled: true
    service:
      annotations:
        prometheus.io/port: "10254"
        prometheus.io/scrape: "true"
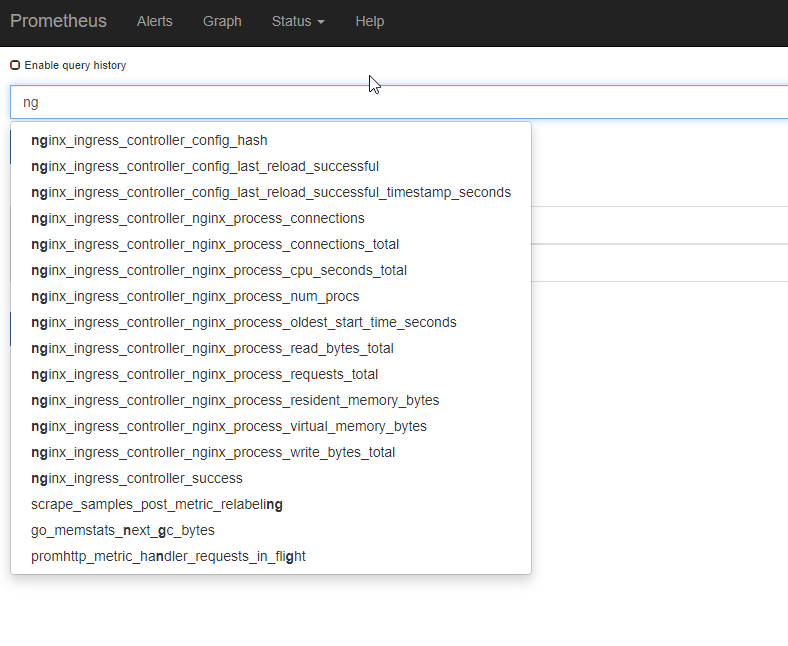
When I now open the Prometheus dashboard (remember: kubectl get nodes and get the external IP address, and open this with the prometheus port shown through kubectl get svc -A) and start typing ng it shows our metrics!
Installing Grafana
From here on, it's a smooth ride to the finish line! We can simply follow the official documentation and install grafana with:
kubectl apply --kustomize github.com/kubernetes/ingress-nginx/deploy/grafana/
Once this is done, we do the same as for prometheus and open the grafana dashboard in our browser (kubectl get nodes; kubectl get svc -A) where we can use admin:admin as our credentials and run the following steps:
- Click "Add data source"
- Select "Prometheus"
- Enter the details (note: I used
http://CLUSTER_IP_PROMETHEUS_SVC:9090) - Left menu (hover over +) -> Dashboard
- Click "Import"
- Enter the copy pasted json from https://raw.githubusercontent.com/kubernetes/ingress-nginx/master/deploy/grafana/dashboards/nginx.json
- Click Import JSON
- Select the Prometheus data source
- Click "Import"
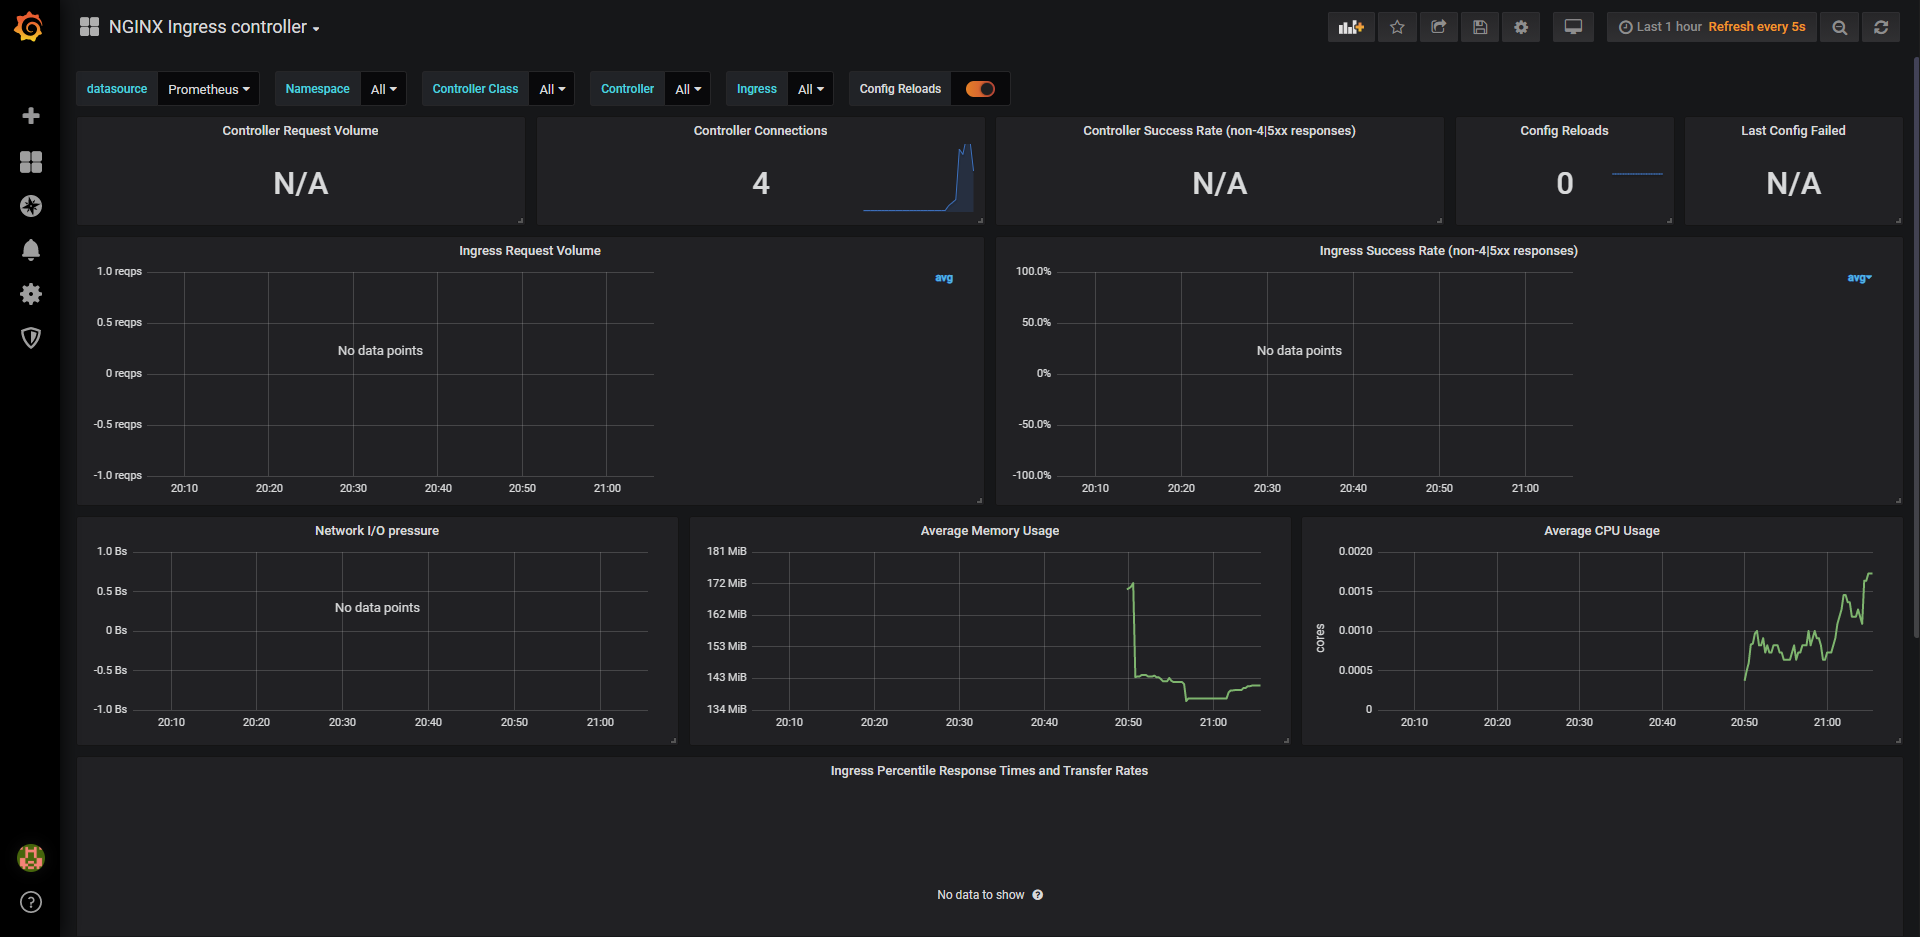
Conclusion
In this article we learned how we can now start monitoring our earlier application its ingress controller. The goal of this is to in a next post be able to auto-scale the created infrastructure based on the incoming requests!


Comments ()