Internet Of Things - Digital Twins Explained

Looking at the history in manufacturing, we saw that many manufacturing companies were deploying statistical models on-edge (e.g. based on parameters such as temperature, pressure and speed, do we send an alert or not), having the main impact on their production volume. If they can then squeeze out this extra bit of improvement, they would thus be able to optimize this process and have a growth in production volume (and net earnings accompanied with it).
While working with large manufacturing enterprises, the trend of seeing them move to the Industrial Internet of Things (IIoT) is quite visible. This can largely be contributed to the fact that Artificial Intelligence models are slowly starting to replace the previously created statistical model due to their benefits such as understanding as well as easiness to train. We just have to feed it data, and it will figure trends out by itself (once we define an optimization parameter). - Very roughly sketched.
Next to the training of Artificial Intelligence models for the Internet of Things, we can also see the creation of a new concept called Digital Twins. But what is this? What will it allow us to do? Let's dig a bit deeper into this concept.
Note: I will be going deeper on the topic of Artificial Intelligence and Digital Twins in a later post
Digital Twin Definition
We can summarize the concept of a Digital Twin in one sentence:
A Digital Twin is a virtual representation of a physical object
The above however might seem a bit "vague" when looking at it for the first time, it also does not clearly indicates the different benefits this might have. So as a lengthier description, a Digital Twin is the concept or hierarchical representation of the different sensors within an object or environment (such as a Wind Turbine, Building, Car, …) that get recreated in a virtual environment so that we are able to illustrate how the different sensors impact each other.
Think of Digital Twin as a "State Representation" of our physical object.
Simple Example
To illustrate the above with a simple example: Take for example a car and its motor, let's describe this in a simple way and in an advanced way showing the sensor changes.
- Simple: When we push the gas pedal, it will accelerate the car.
- Advanced: When we push the gas pedal, the throttle valve will be opened more, allowing more air to enter the engine. The Engine Control Unit (ECU) will notice this change of the throttle valve and will then increase the fuel rate.
Notion of Hierarchy
What we can see in the example above is the hierarchy between components. We have a gas pedal connected to a throttle valve which in its turn will be picked up by the ECU. There is thus a notion of "hierarchy" that we should incorporate in our Digital Twin. It should show us the interconnection state of what happens between the components when one of them triggers something.
E.g. when in our example above the ECU detects a change of the throttle valve, which other components are being affected by it?
Use Cases
Digital Twins of course have their specific use cases, when applying them correctly we can see them coming back in the following:
- Simulation Creation
- Real-time training
- Component dependency
- …
But to make all of this a bit clearer, let's go through an End-to-End example that illustrates a Digital Twin being created and represented visually.
Digital Twin - Windmill Example
For our End-to-End example, I will take the description of a Windmill. We will analyze this physically in terms of Sensor composition as well as how this would translate in the Digital Twin concept.
Physical Description
When looking at a windmill, we can decompose this in different physical parts:
- Gearbox
- Rotor
- Blade
- Tower
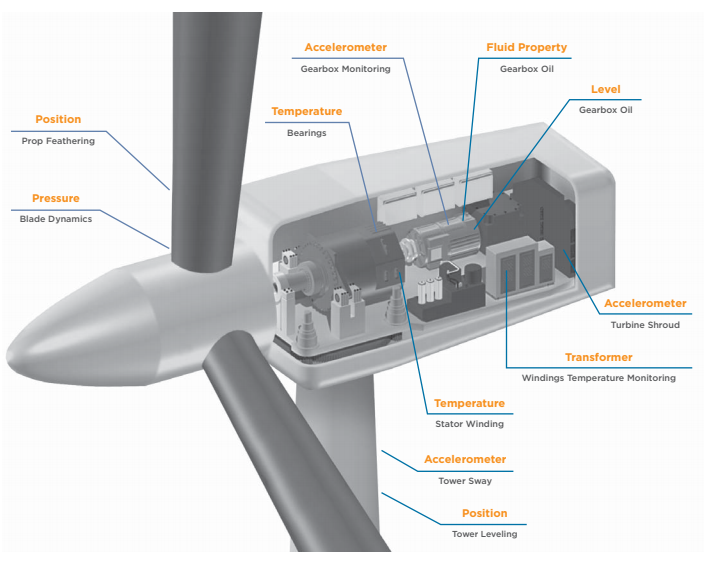
Each of these parts has different sensors connected to it that monitor the working of our Wind Turbine. The picture below illustrates the different components and their connected sensors.

Virtual Description - Building our Twin
Since we now understand our physical object, let's transform this into a virtual object. Showing the relation between the different components, as well as enriching the Digital Twin with extra data that might be beneficial for our end purposes.
Note: In my case, I added a Weather API as enriching data, as well as slimmed down the amount of sensors for illustration purposes.
When we map this graphically, we can find something like this:
Now of course for any system to understand this, we should map this to a kind of definition language. Doing this for our picture, we can achieve something that looks like the below.
// API
api weather {
  int windSpeed [0, 90] # in mph
  enum windOrientation { N, NE, E, SE, S, SW, W, NW }
}

// Gearbox
sensor gearboxOilLevel {
  bool isOk
}

sensor gearboxAccelerometer {
  float xAccel [-40.0, 40.0]
  float yAccel [-40.0, 40.0]
  float zAccel [-40.0, 40.0]
}

twinItem gearbox {
  gearboxOilLevel g1
  gearboxAccelerometer g2
}

// Stator
sensor statorBearingsTemperature {
  float [0, 1500] // Kelvin
}

sensor statorWindingsTemperature {
  float [0, 1500] // Kelvin
}

twinItem stator {
  statorBearingsTemperature s1
  statorWindingsTemperature s2
}

// Blade (= Rotor)
sensor bladeRotation {
  float rotation [0.0, 360.0]
}

sensor bladePressure {
  float bar [0, 1000]
}

sensor bladeSpeed {
  float RPM [0, 60]
}

twinItem blade {
  bladeRotation b1
  bladePressure b2
  bladeSpeed b3
}

// Composition
twinItem windTurbineSensors {
  gearbox
  stator
  blade
}

twin windTurbine {
  windTurbineSensors wt
  weather apiWeather
}
Conclusion
I hope that by reading the article above I was able to explain the concept of Digital Twins in a bit more detail.
Please feel free to reach-out to me in case of questions.


Comments ()