
How-To Visualize Metrics with Grafana and Chronograf by using InfluxDB

Visualizing is an important part of working with data. Here I will walk you step by step on how you can create a working Visualization dashboard with Grafana and Chronograf which queries events through InfluxDB.
This post is part of the "Real Time Streaming Dashboard" series which can be found here: /real-time-streaming-dashboard
[Time Series DB] Creating InfluxDB
The easiest way to create an application without too much operational cost, is by deploying it as a container instance situated in the PaaS operating model. Here I am using Azure Container Instances, which allows me to deploy a container within mere seconds after configuration.
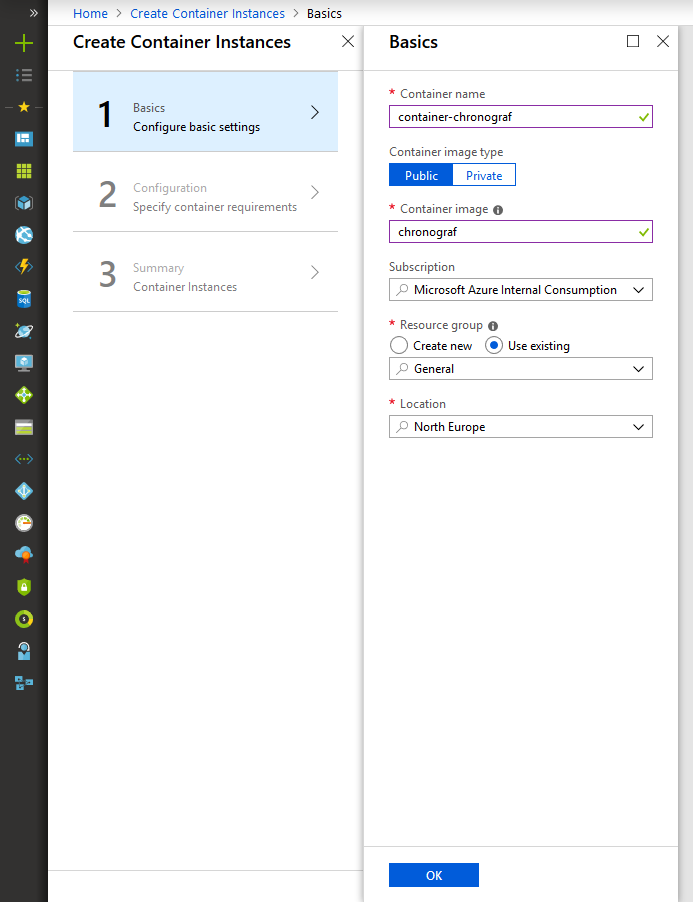
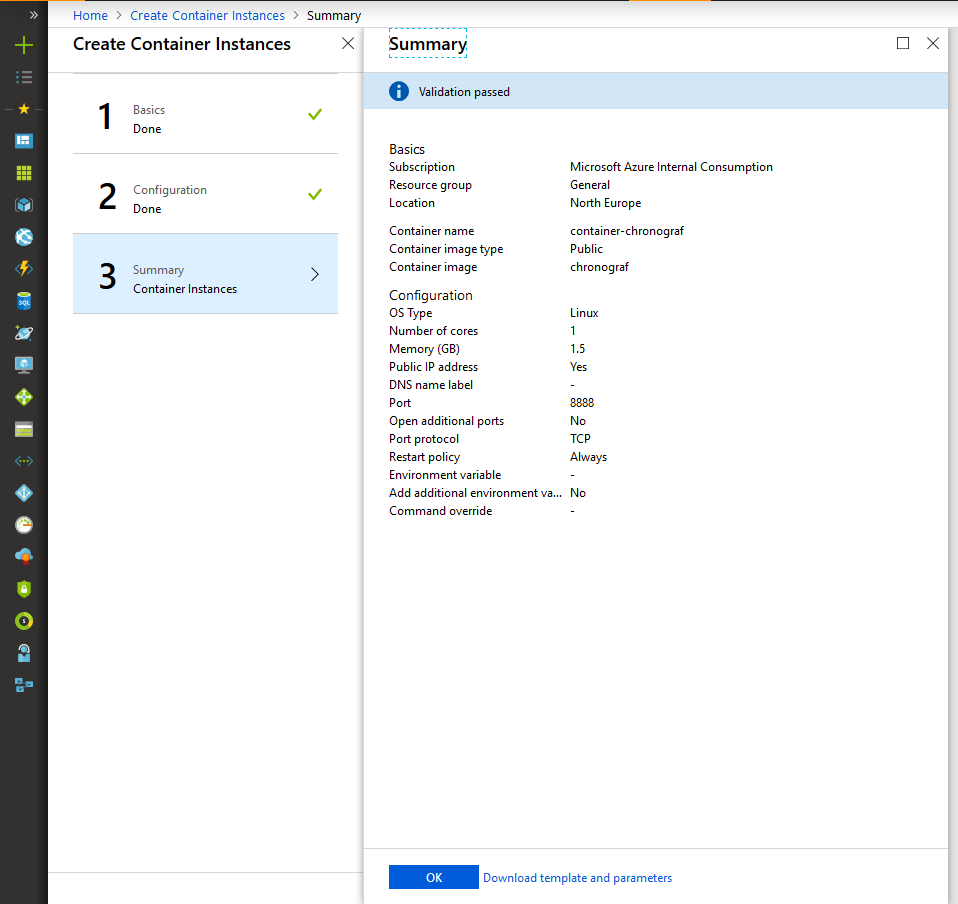
To do this, go to the marketplace by searching for "Container Instance" and click on "create". Now use the details as shown below to configure our InfluxDB container.
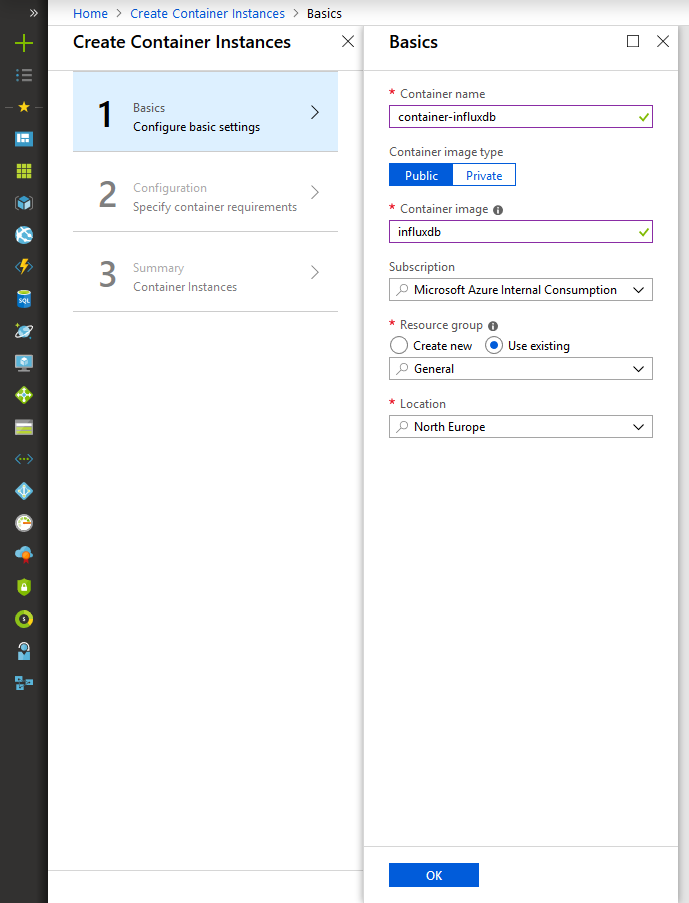
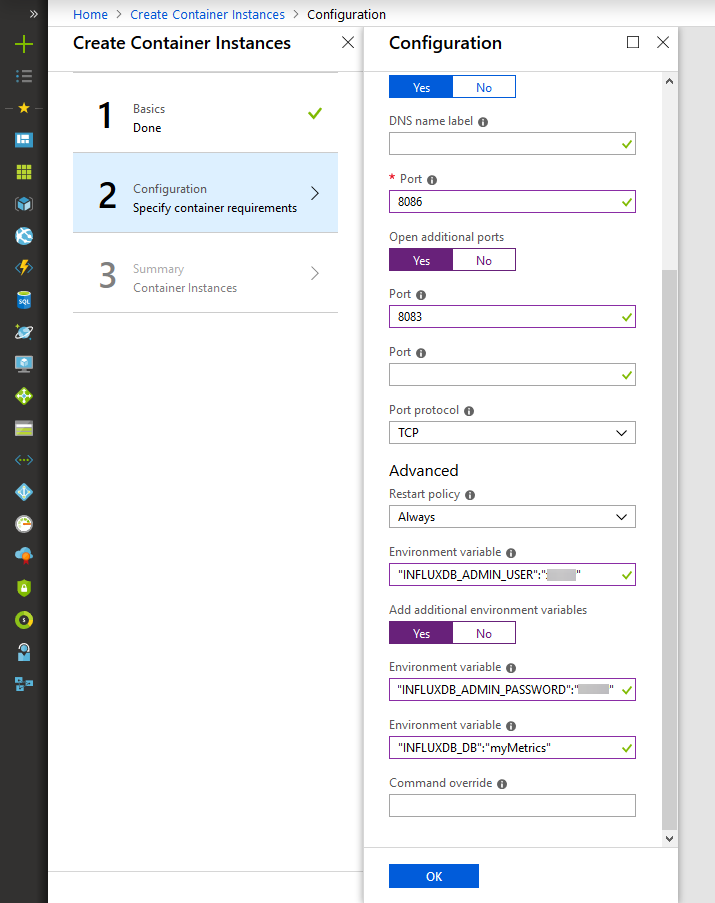
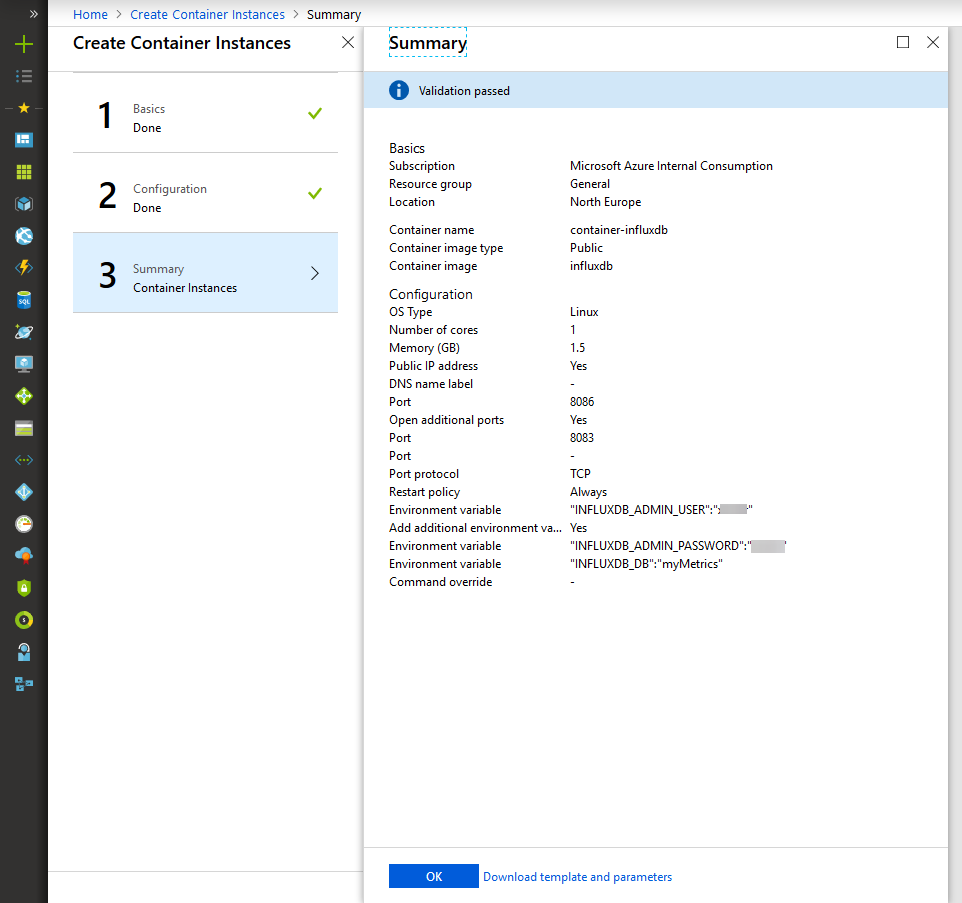
If everything went ok, you will now be able to access InfluxDB on your FQDN:8086 endpoint through: http://<FQDN>:8086 which will show an error message 404 page not found, which means we did it well and that InfluxDB is running.
[Visualize] Create Grafana
Just as with our InfluxDB container, we will also be creating a Grafana container that will host our Grafana application. For this we use the details below.
Since Grafana is open-source, feel free to check the code here: https://github.com/grafana/grafana
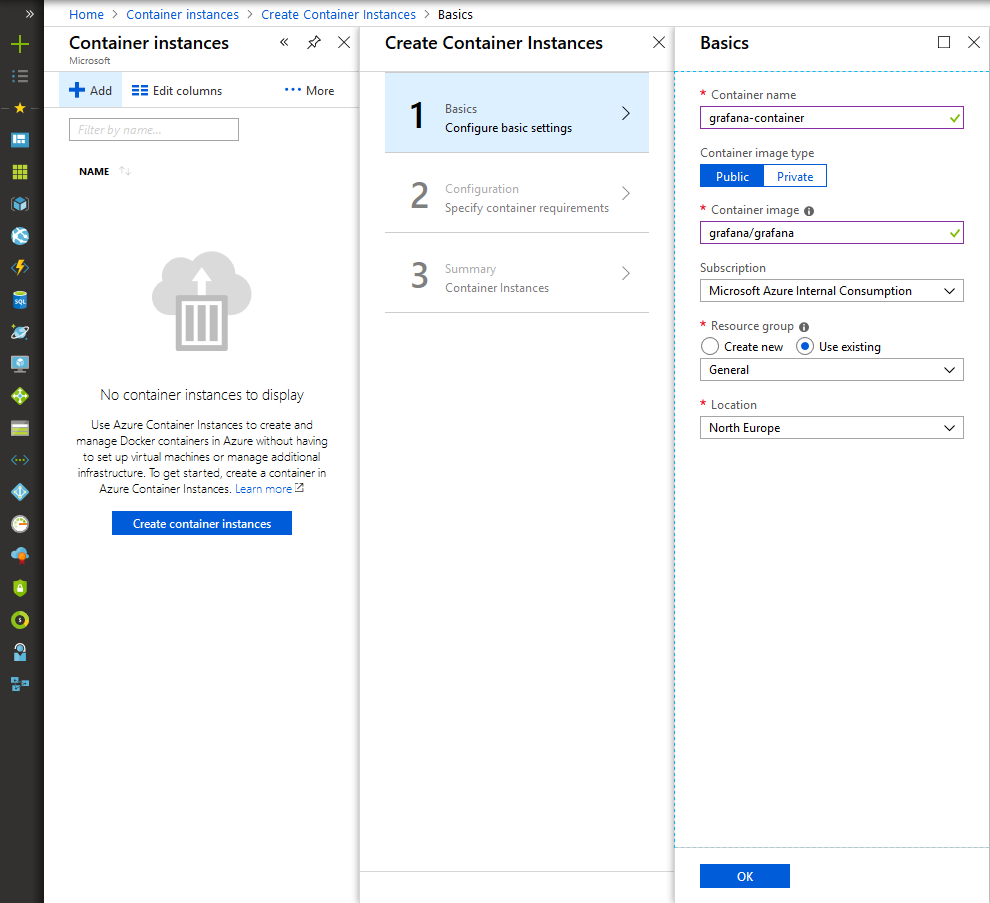
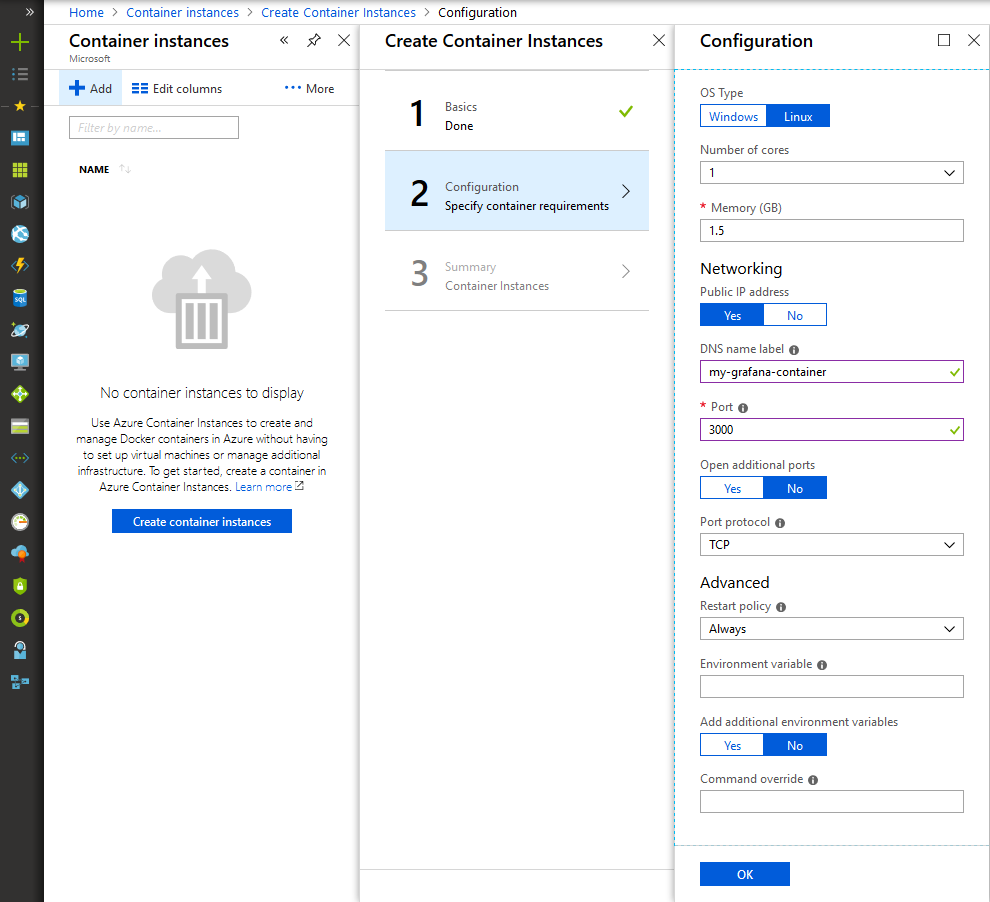
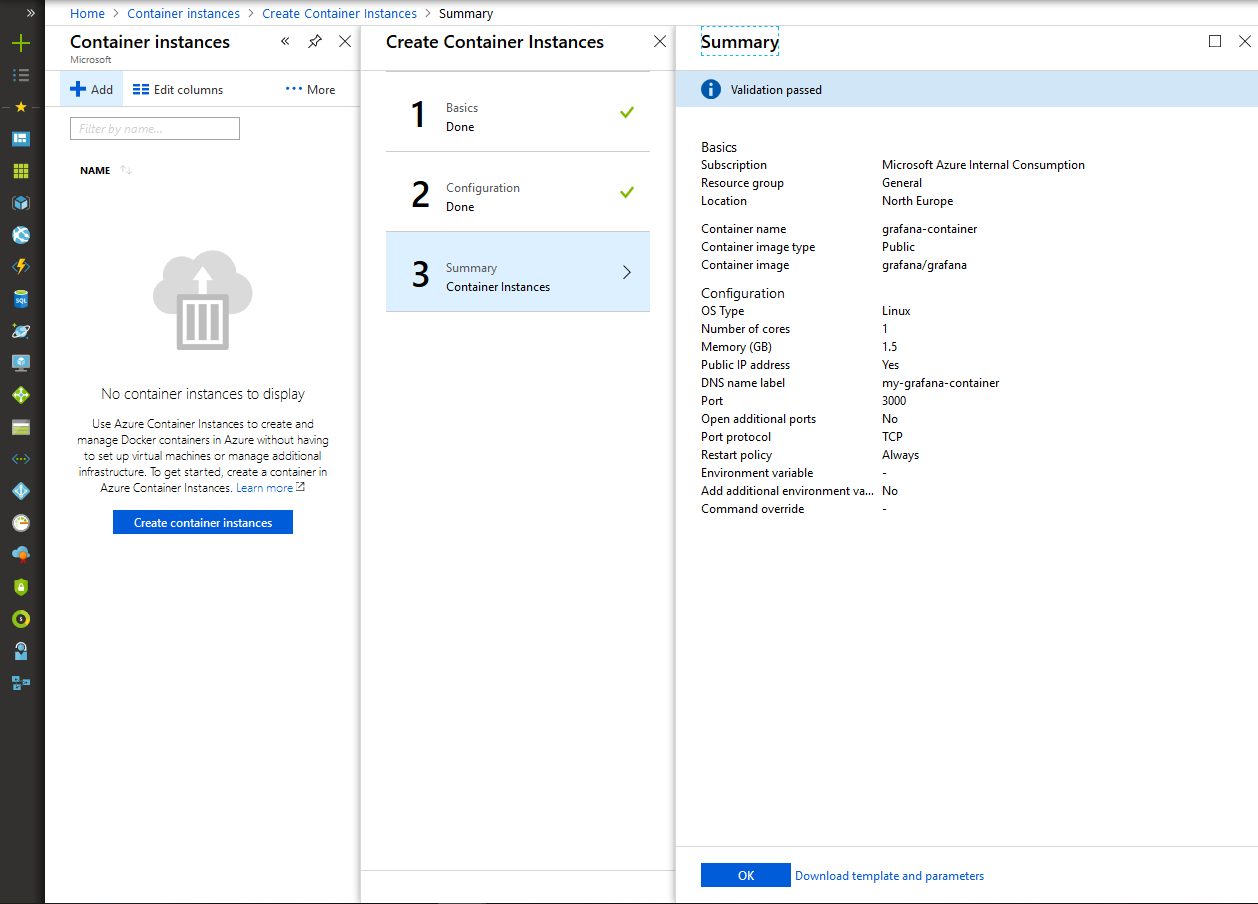
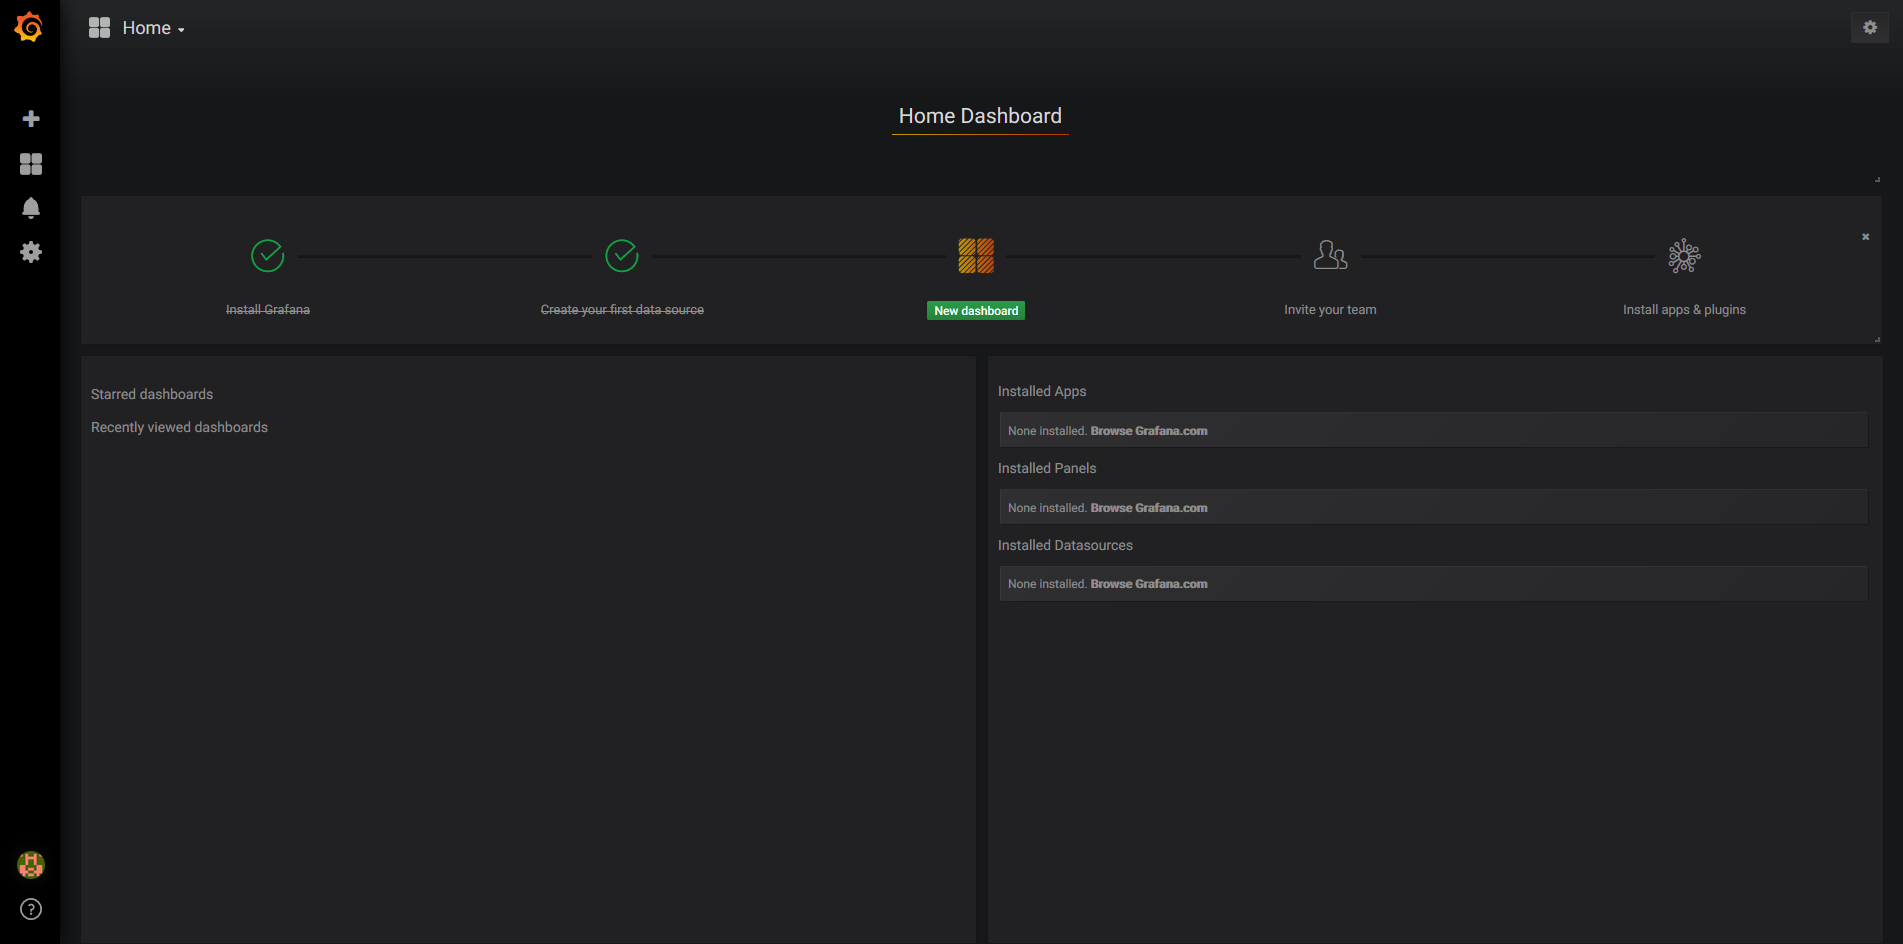
If everything went ok, you will now be able to go to your http://<FQDN>:3000 and be presented with the Grafana login screen.
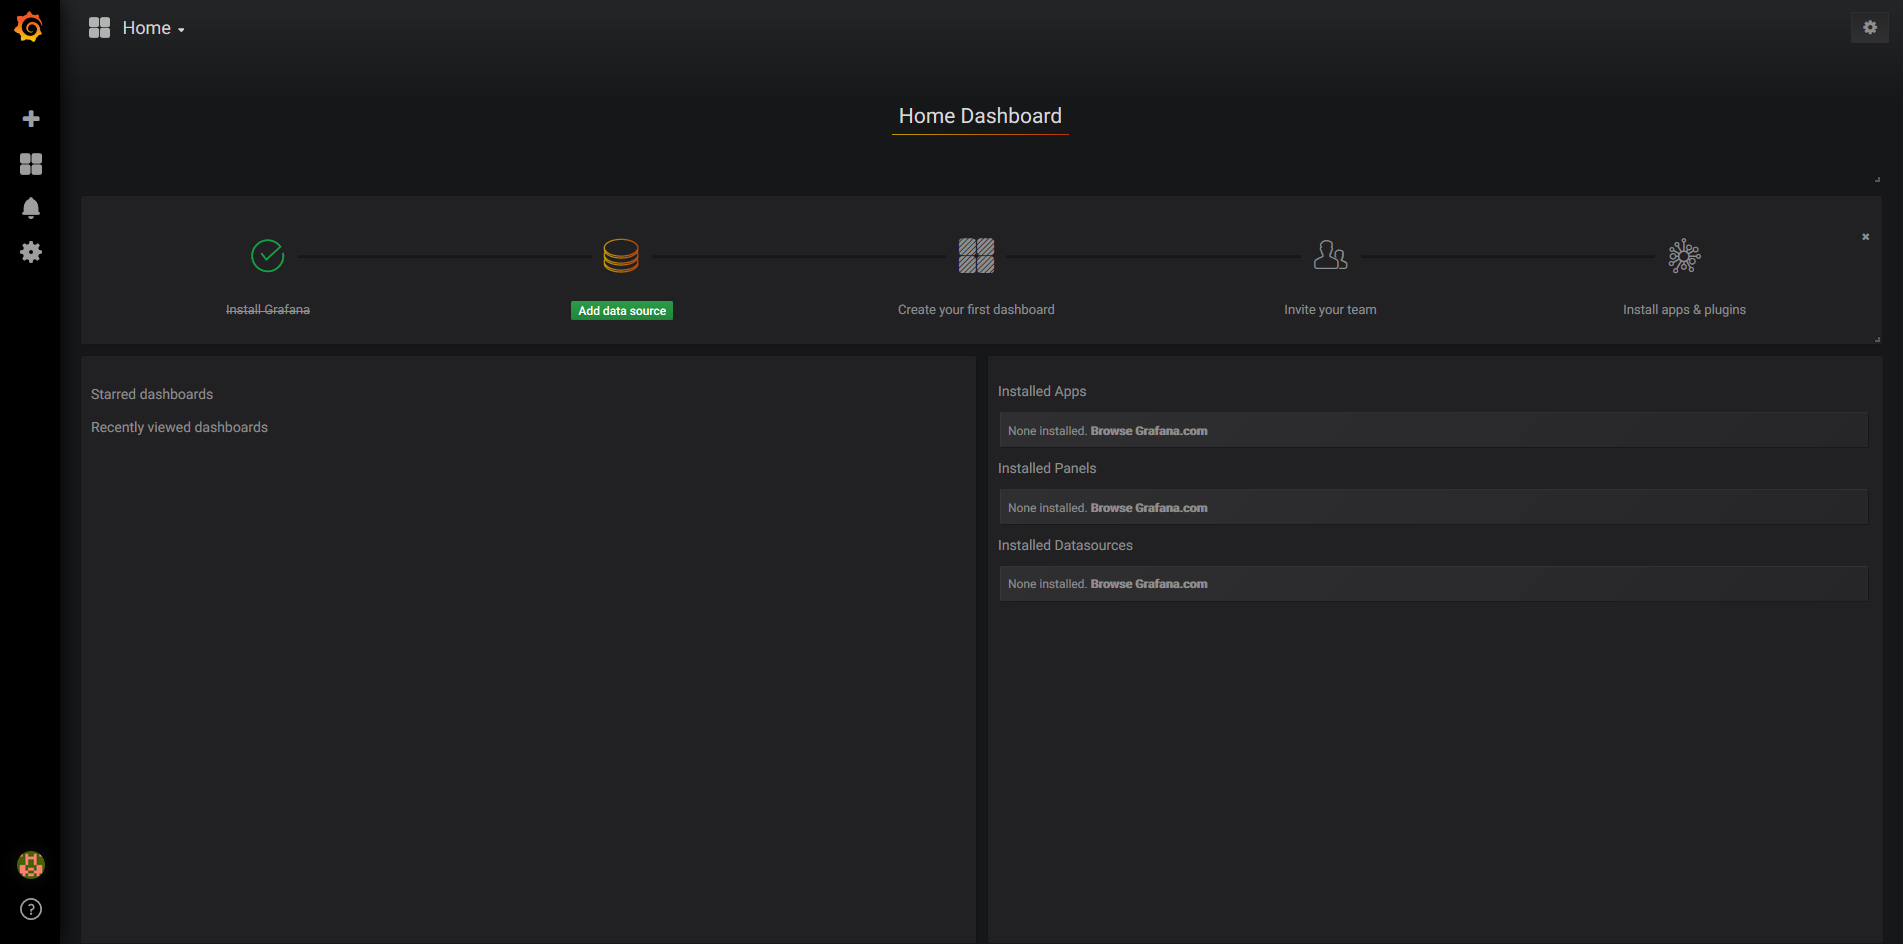
Note: The default login details are "admin"/"admin", to change those, use the environment variables as described in: http://docs.grafana.org/installation/docker/Continue by logging in to the Grafana login screen, whereafter you will be presented by a setup screen, showing a green buttin called "Add Data Source". Click it, to configure your first data source which will link to our previously created InfluxDB container.
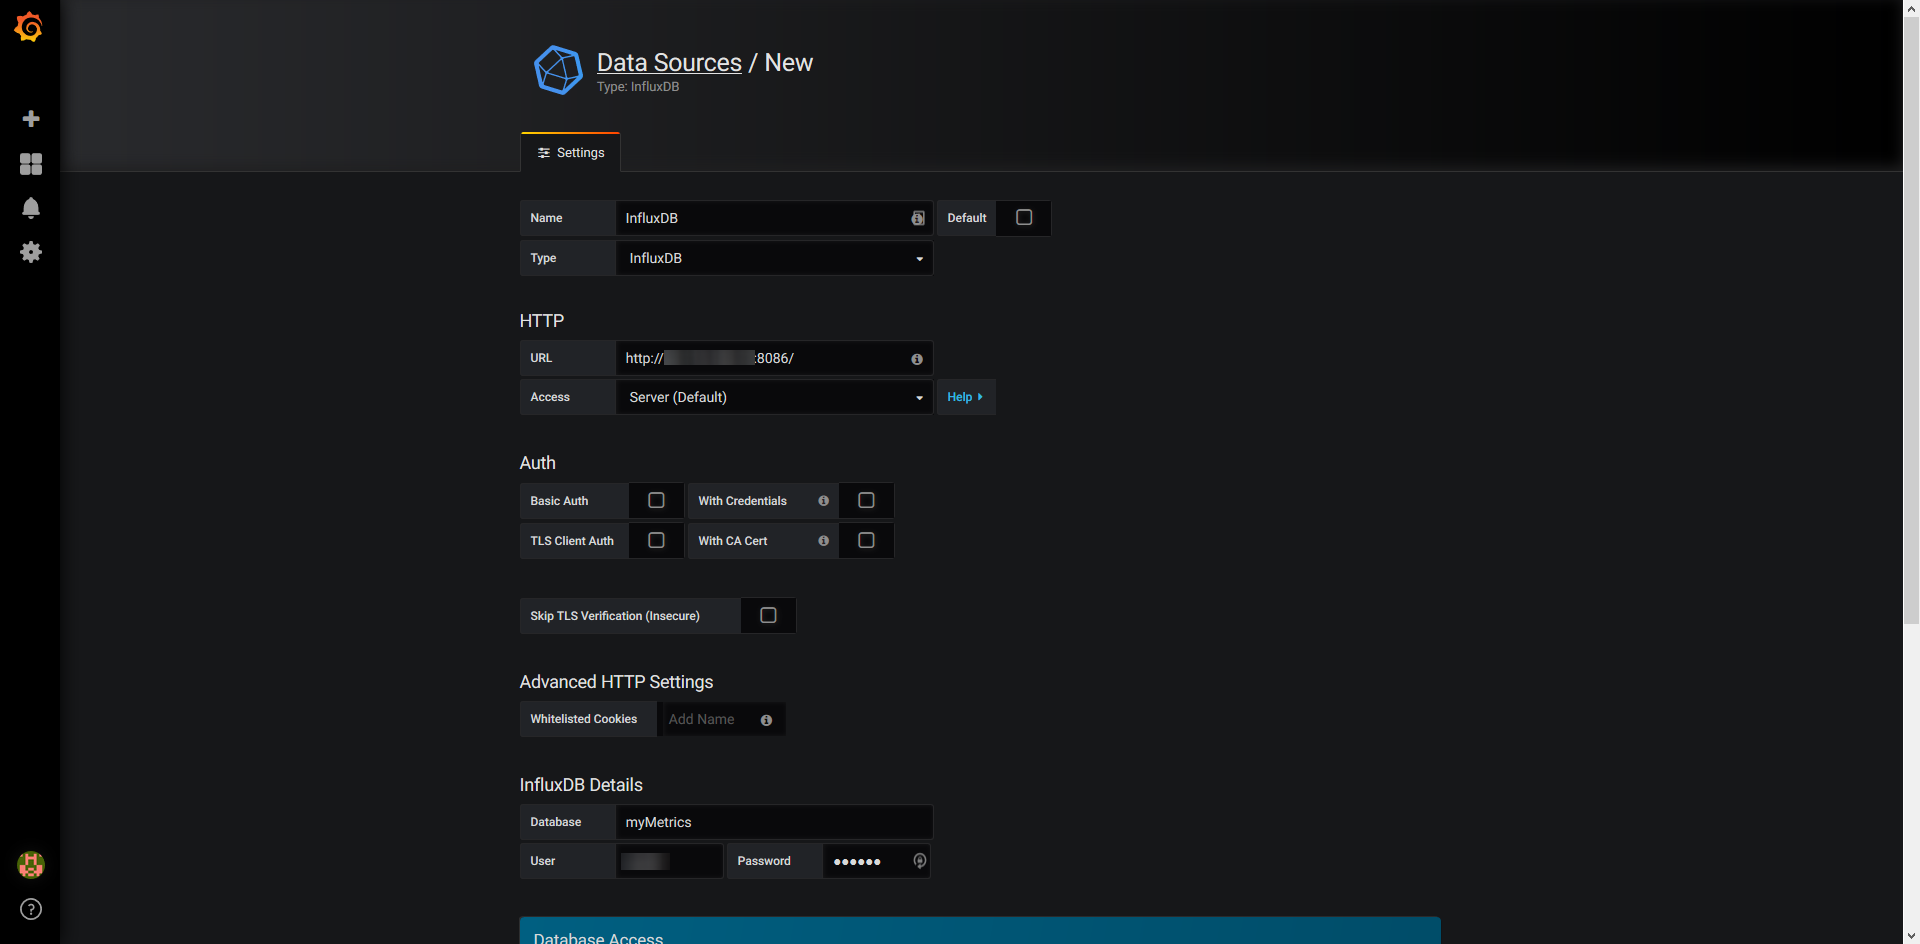
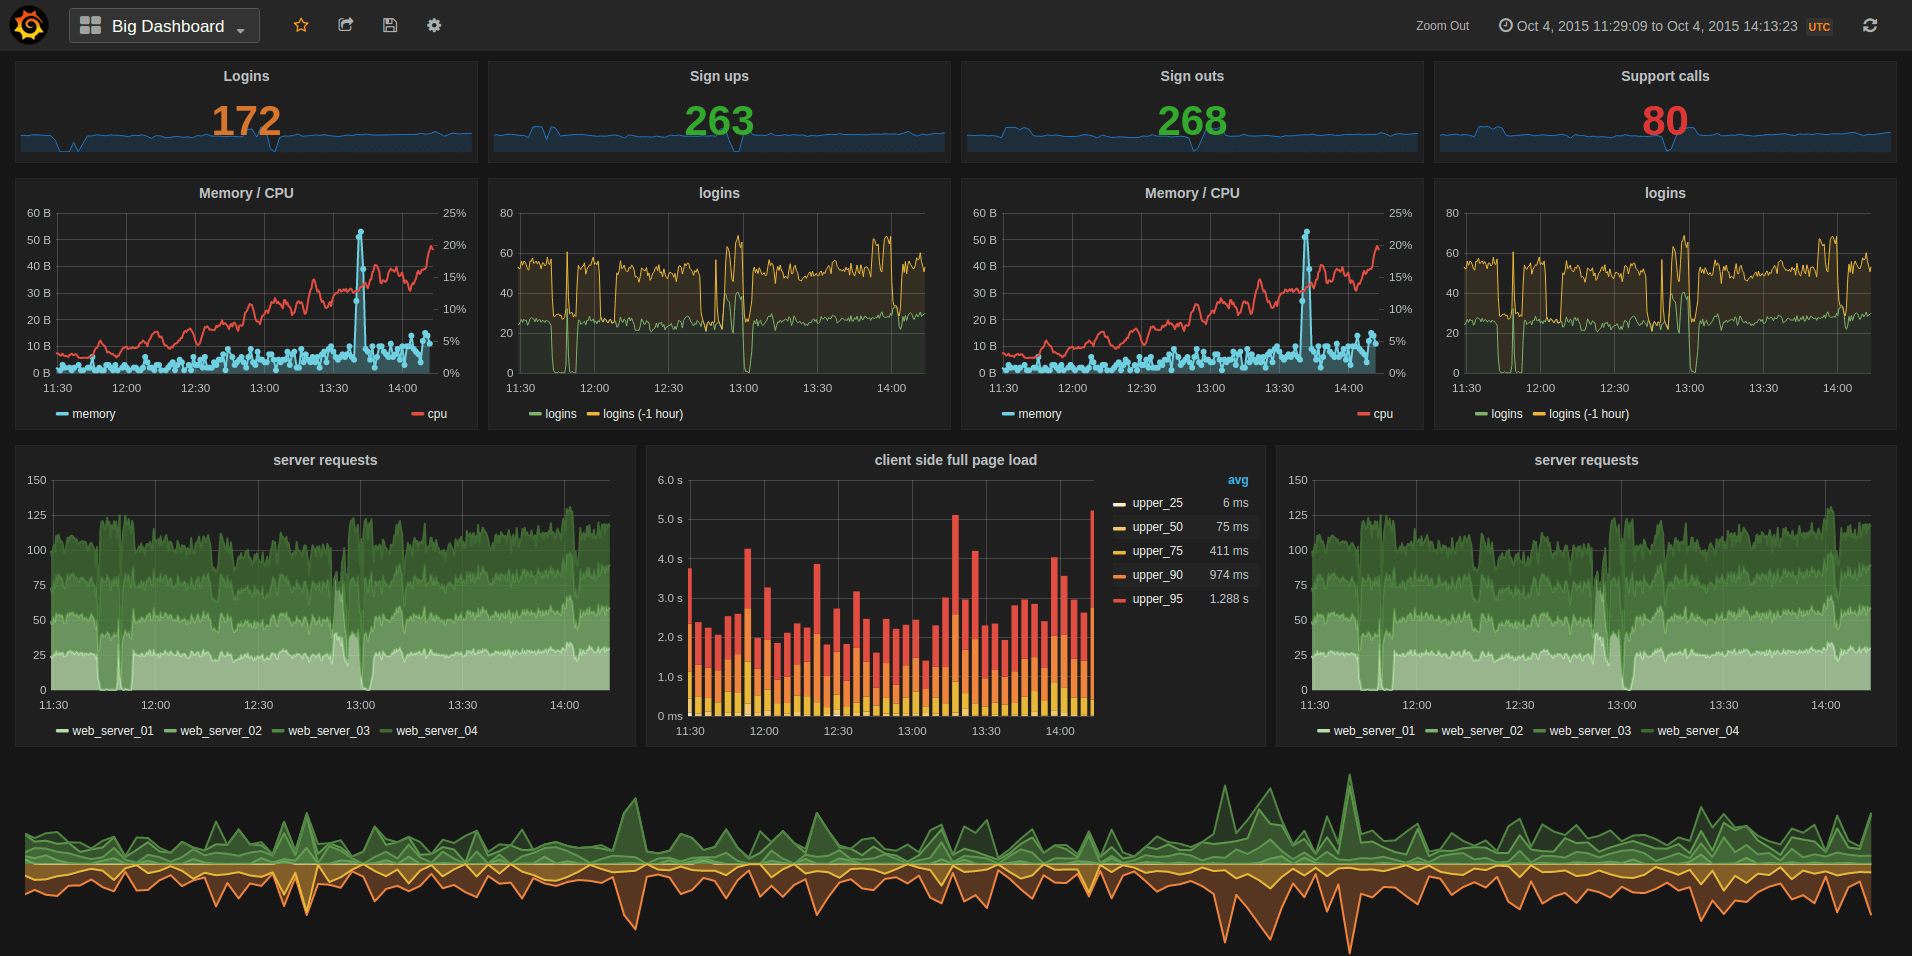
Once you clicked "Save & Test", go back to our main page by entering our URL http://<FQDN>:3000/ again to create your first Dashboard. Go Aheard by clicking the "New Dashboard" button, to start visualizing your InfluxDB data.
After playing around a little bit, you should have something that can look like this:
[Visualize] Create Chronograf
Another way of creating real-time dashboards is through a tool called "Chronograf". We can kind of compare Chronograf to the eco-system of the ELK Stack (Elasticsearch, Logstash and Kibana), but where Chronograf is created by the people behind InfluxDB.
To start, we again create a container instance with the details below:
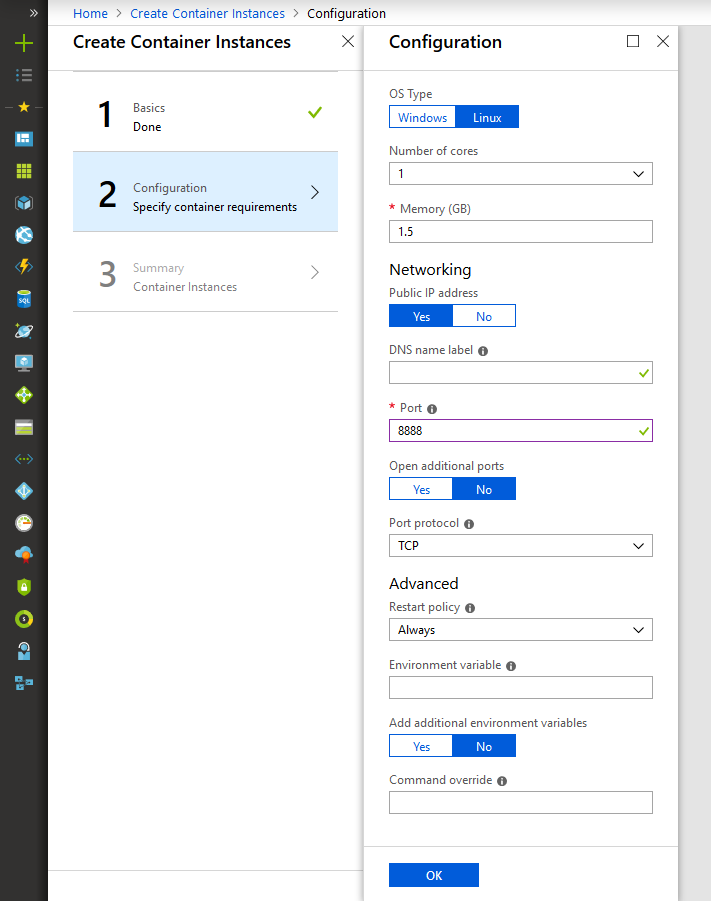
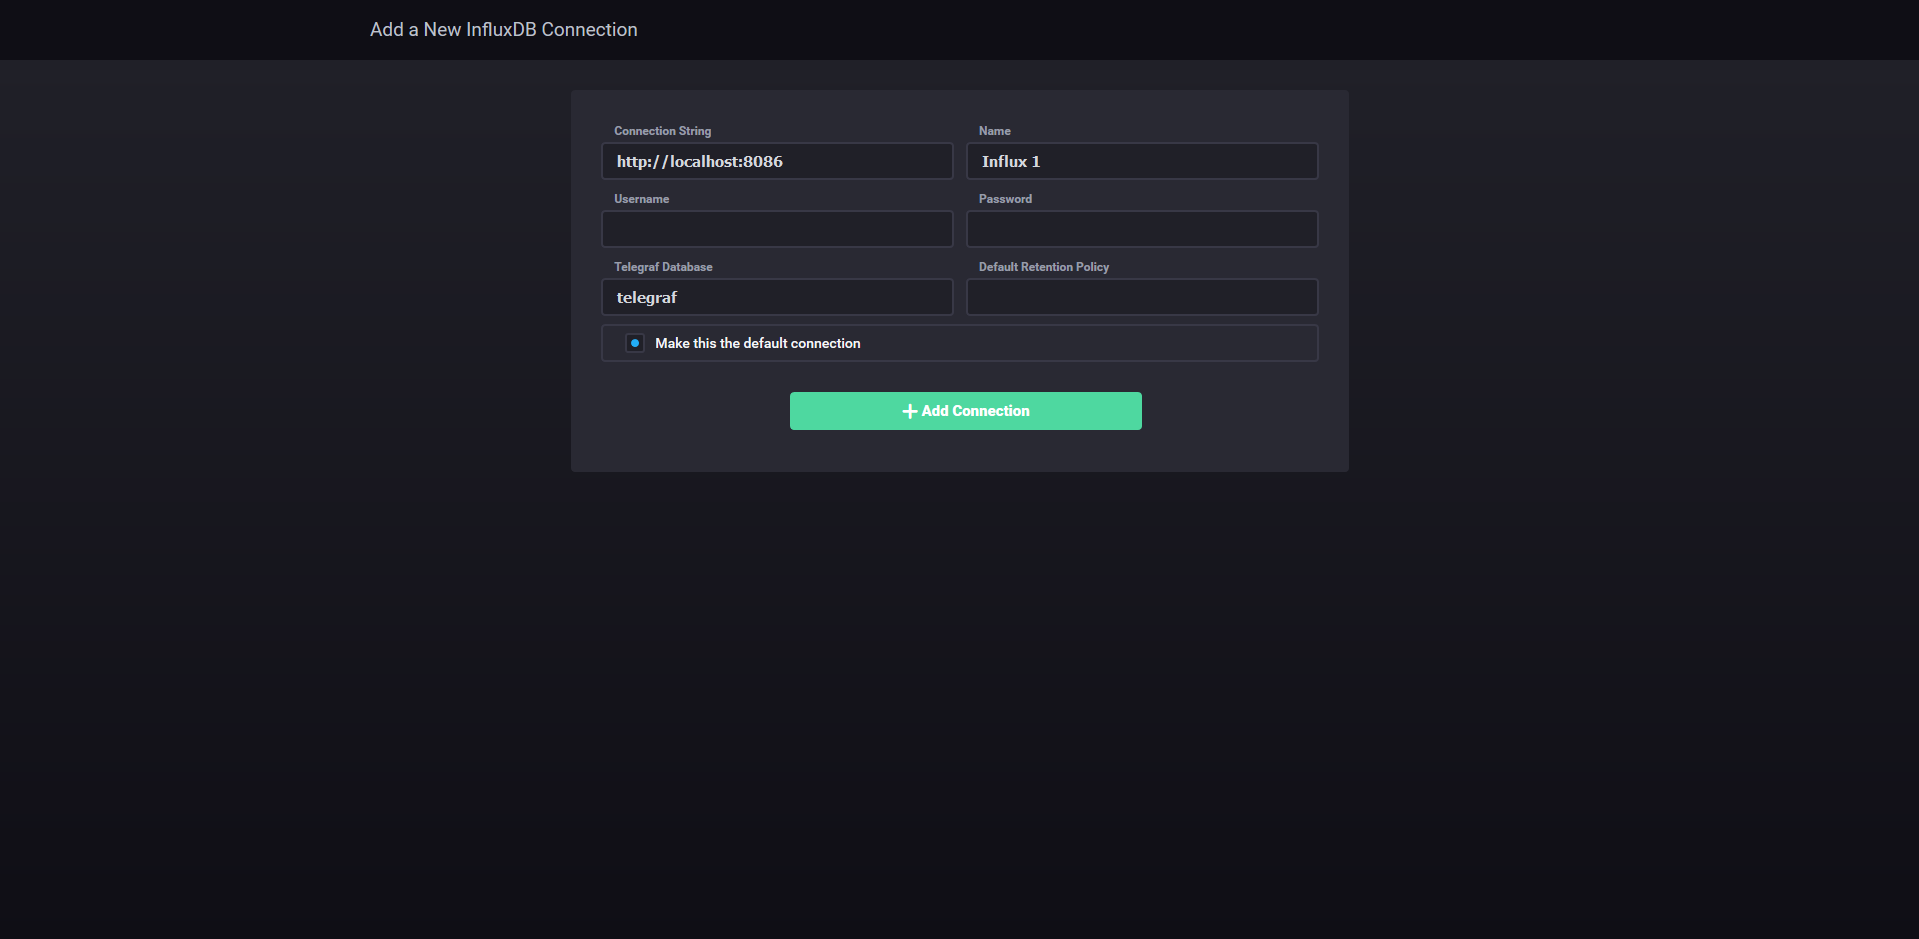
whereafter we will be able to navigate to the setup page located at: http://<FQDN>:8888 and be presented by a beautiful setup screen. On here, fill in your details towards your InfluxDB and click the "Add Connection" button to continue towards your home screen.
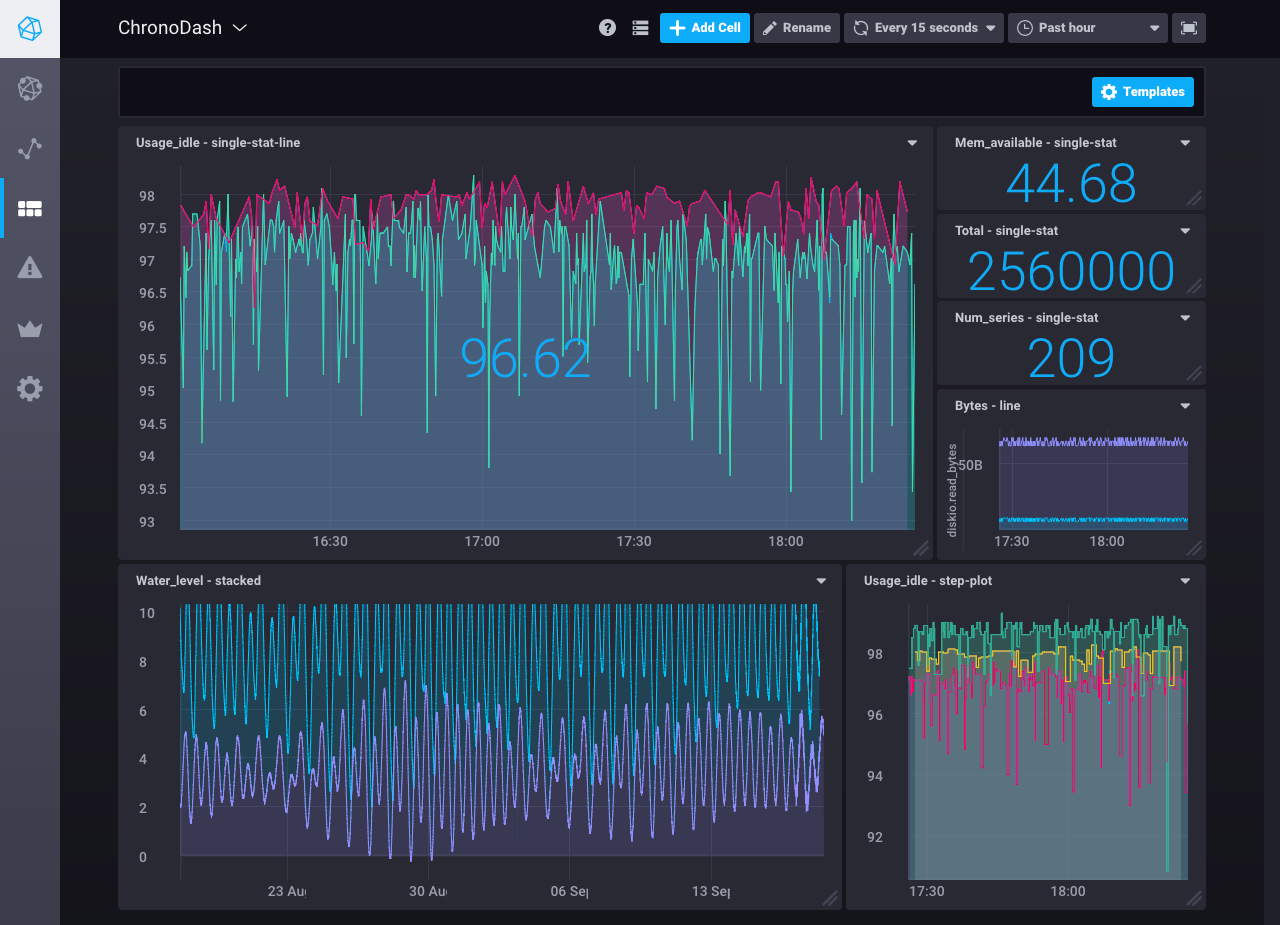
You can now go to the dashboard tab and start creating your dashboard, eventually ending up with something that can look like this:

Comments ()