Building a real-time streaming dashboard with Spark, Grafana, Chronograf and InfluxDB

When you work with the Internet of Things (IoT) or other real-time data sources, there is one things that keeps bothering you, and that's a real-time visualization dashboard. So in this post, I will explain how you can set up a pipeline that allows you to visualize through 2 popular visualization tools: Chronograf and Grafana.
Note: This post will not cover setting up Grafana nor Chronograf due to the amount of work required. For more information about how to set these up, feel free to check this other post: Visualize metrics with Grafana and InfluxDB
Architecture
Let's start by discussing what we will be creating and why we are creating it like this. The eventual architecture will be something that looks like this:
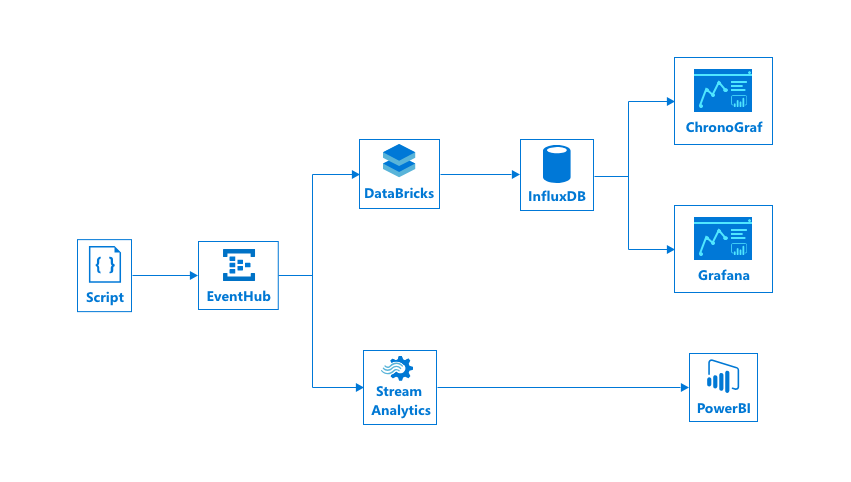
We can identify several components in here:
[Stream] EventHub
Description: EventHub Allows us to ingest and distribute events from one component to the other.
Why? We use an EventHub because we will be processing a lot of IoT events, which is easier if we have one single point where all our data comes in and that we can pipe to other components. Note that we are not using an IoT Hub which can also manage our IoT Devices, because we will be sending our data from a custom built script so there is no need for device management.
Alternatives?
- Apache Kafka (#opensource, kind of like EventHub)
- IoT Hub (Includes device management and things such as configuration pushing)
[Spark Engine] Databricks #opensource
Description: Databricks is a platform that allows you to process big data and streams through the use of the Spark platform.
Why? We want to be able to ingest our stream, modify it and stream it to our dashboard. A component such as this allows for a easy redistribution, while being able to modify our stream. We can do things such as multiple endpoint streaming, data windowing, …
Alternatives?
- Azure Stream Analytics
- CosmosDB (We use the change-feed here)
[Dashboard] Chronograf
Description: Chronograf is the interface component of InfluxData, created to make it easy to visualize and explore this data.
Why? For a real-time dashboard, we want to be able to see our events in less than 1 minute of delay, Chronograf does just this, it allows us to set a refresh interval of 5 seconds, which covers our need of showing this data near real-time. If we want an even lower refresh interval, we are looking towards socket solutions, which are quite hard to come by on this moment. Interesting to note here is that Chronograf requires us to use InfluxDB, which implicates a small lock-in being generated on this level. If you wish to avoid this, feel free to continue with Grafana as shown below.
Alternatives?
- PowerBI
- Kibana (ELK Stack)
- Grafana
[Dashboard] Grafana
Description: Grafana is a tool for monitoring and analysing metrics through data sources such as Graphite, InfluxDB, Prometheus and many more.
Why? For a real-time dashboard, we want to be able to see our events in less than 1 minute of delay, Grafana does just this, it allows us to set a refresh interval of 5 seconds, which covers our need of showing this data near real-time. If we want an even lower refresh interval, we are looking towards socket solutions, which are quite hard to come by on this moment. The major difference with Chronograf is that Grafana integrates with more datasources on this moment, allowing us to evade a lock-in generated on this level.
Alternatives?
- PowerBI
- Kibana (ELK Stack)
- Chronograf
Configuring our components
InfluxDB & Grafana
To configure our InfluxDB, Grafana and Chronograf containers, feel free to check out my other post at /howto-visualize-metrics-with-grafana-and-influxdb
Event Hub
To configure our Event Hub check out my blog post "Sending and Receiving events with Azure Event Hub".
Once you created an Event Hub create a consumer group and your Policy Key with the "Listen" permission. More information for this you can find here
Make sure to note down the following details
- PolicyName
- PolicyKey
- NamespaceName - This is the name of where all your EventHubs are located
- EventHubName - This is the name of the EventHub you created
- ConsumerGroupName - This is the consumer group that you created under your EventHub. The default name is:
$Default
DataBricks
For our DataBricks, set up an account through the awesome documentation
Now we can log in on our Databricks portal and start creating our script that will ingest our data from EventHub. Start by creating your first notebook (I am using Scala here) and let's see what we need to put in it to connect to our event stream and process the data towards our visualization tools.
Connecting to EventHub
Before we can connect to EventHub, we need to add a Maven library. For this, click "Workspace" -> "Shared" -> Under the arrow click "Create" -> "Library". Now search after "azure-eventhubs-spark_2.11-2.3.2" and install and attach it to the cluster.
Once all this pre-setup is done, we can go to our notebook and connect to our EventHub with the following bit of code:
// Note: Before you can use these packages you need to add the Maven coordinate: com.microsoft.azure:azure-eventhubs-spark_2.11:2.3.2
//       See https://docs.databricks.com/user-guide/libraries.html#maven-libraries for how to do so
//       More info: https://docs.databricks.com/spark/latest/structured-streaming/streaming-event-hubs.html
import org.apache.spark.eventhubs.{ ConnectionStringBuilder, EventHubsConf, EventPosition, EventHubsUtils }

// Connect to EventHub
val connectionString = ConnectionStringBuilder("Endpoint=<your_connection_string>")
  .setEventHubName("<your_eh_name>")
  .build();

val eventHubsConf = EventHubsConf(connectionString)
  .setStartingPosition(EventPosition.fromEndOfStream);

// eventHubs is a org.apache.spark.sql.DataFrame object
val eventHubs = spark.readStream
  .format("eventhubs")
  .options(eventHubsConf.toMap)
  .load();
If we now run this cell, we will see our variables initialized.
Performing ETL on our incoming EventHub data
To see the schema of the EventHub data coming in, we can utilize the printSchema method:
// Print schema of our stream
eventHubs.printSchema()
Here we see a field called body which contains our EventHub events data, but in a binary format. We thus have to parse this towards our original JSON format, together with correctly casting the variables.
import org.apache.spark.sql.types._ // https://spark.apache.org/docs/latest/api/java/org/apache/spark/sql/types/package-summary.html
import org.apache.spark.sql.functions._

// Our JSON Schema
val jsonSchema = new StructType()
  .add("sensor", StringType)
  .add("temperatureValue", StringType)
  .add("humidityValue", StringType)
  .add("createdAt", StringType)

// Convert our EventHub data, where the body contains our message and which we decode the JSON
val messages = eventHubs
  // Parse our columns from what EventHub gives us (which is the data we are sending, plus metadata such as offset, enqueueTime, ...)
  .withColumn("Offset", $"offset".cast(LongType))
  .withColumn("Time (readable)", $"enqueuedTime".cast(TimestampType))
  .withColumn("Timestamp", $"enqueuedTime".cast(LongType))
  .withColumn("Body", $"body".cast(StringType))
  // Select them so we can play with them
  .select("Offset", "Time (readable)", "Timestamp", "Body")
  // Parse the "Body" column as a JSON Schema which we defined above
  .select(from_json($"Body", jsonSchema) as "sensors")
  // Now select the values from our JSON Structure and cast them manually to avoid problems
  .select(
    $"sensors.sensor".cast("string"),
    $"sensors.createdAt".cast("timestamp"),
    $"sensors.temperatureValue".cast("double") as "tempVal",
    $"sensors.humidityValue".cast("double") as "humVal"
  )

// Print the schema to know what we are working with
messages.printSchema()
Interesting to note here is the double casting being done, one in the JSON schema definition and one in the SQL select. This is done since when we do this in our JSON structure, we receive null values because of an incorrect parse.
As a debug method, we can now write our stream to memory and see if everything is coming in successfully:
// Display the stream
val messagesStream = messages.writeStream
  .outputMode("append")
  .format("memory")
  .option("truncate", false)
  .queryName("streamData")
  .start()

display(messages)
Sending our parsed events to InfluxDB
To connect to InfluxDB, we use a library called Chronicler which can be found at: https://github.com/fsanaulla/chronicler and https://github.com/fsanaulla/chronicler-spark.
We install it as we did before, by adding the libraries to our shared folder. The following libraries need to be installed:
com.github.fsanaulla:chronicler-akka-http
com.github.fsanaulla:chronicler-async-http
com.github.fsanaulla:chronicler-url-http
com.github.fsanaulla:chronicler-udp
com.github.fsanaulla:chronicler-macros
com.github.fsanaulla:chronicler-spark-structured-streaming
Once this is done, go back to your notebook and start adding your connection code:
// Create a connection to our InfluxDB
import com.github.fsanaulla.chronicler.async.Influx
import com.github.fsanaulla.chronicler.core.model.{InfluxConfig, InfluxCredentials}

import scala.util.{Success, Failure}
import scala.concurrent.ExecutionContext.Implicits.global

implicit lazy val influxConf: InfluxConfig = InfluxConfig("<host>", 8086, Some(InfluxCredentials("<user>", "<pass>")), gzipped = false)
Whereafter we can send our Events to InfluxDB by defining a writer that defines how we serialize our events in the tag and field format InfluxDB requires, and starting our stream with the .saveToInflux and .start.
// Save our stream to InfluxDB
//import com.github.fsanaulla.chronicler.spark.ds._ // DataFrame = DataSet[Row]
import com.github.fsanaulla.chronicler.spark.structured.streaming._
import com.github.fsanaulla.chronicler.macros.Macros
import com.github.fsanaulla.chronicler.macros.annotations.{field, tag}
import com.github.fsanaulla.chronicler.core.model.InfluxWriter
import com.github.fsanaulla.chronicler.core.model.Point

//case class Entity(@tag sensor: String, @field createdAt: Int, @field tempVal: Double, @field humVal: Double)
//implicit val wr: InfluxWriter[Entity] = Macros.writer[Entity]

implicit val wr: InfluxWriter[Row] = new InfluxWriter[Row] {
   override def write(o: Row): String = {
     val sb = StringBuilder.newBuilder

     // Query looks like: <tags> <fields> <timestamp RFC3339>
     sb.append(s"sensor=${o(0)}")
       .append(" ")
       .append("tempVal=")
       .append(o(2))
       .append(",")
       .append("humVal=")
       .append(o(3))

     sb.toString()
   }
}

// Create our stream
val stream = messages
  .writeStream // Create a WriteStream
  .saveToInflux("myMetrics", "myValues")
  .start()
Creating our dashboards
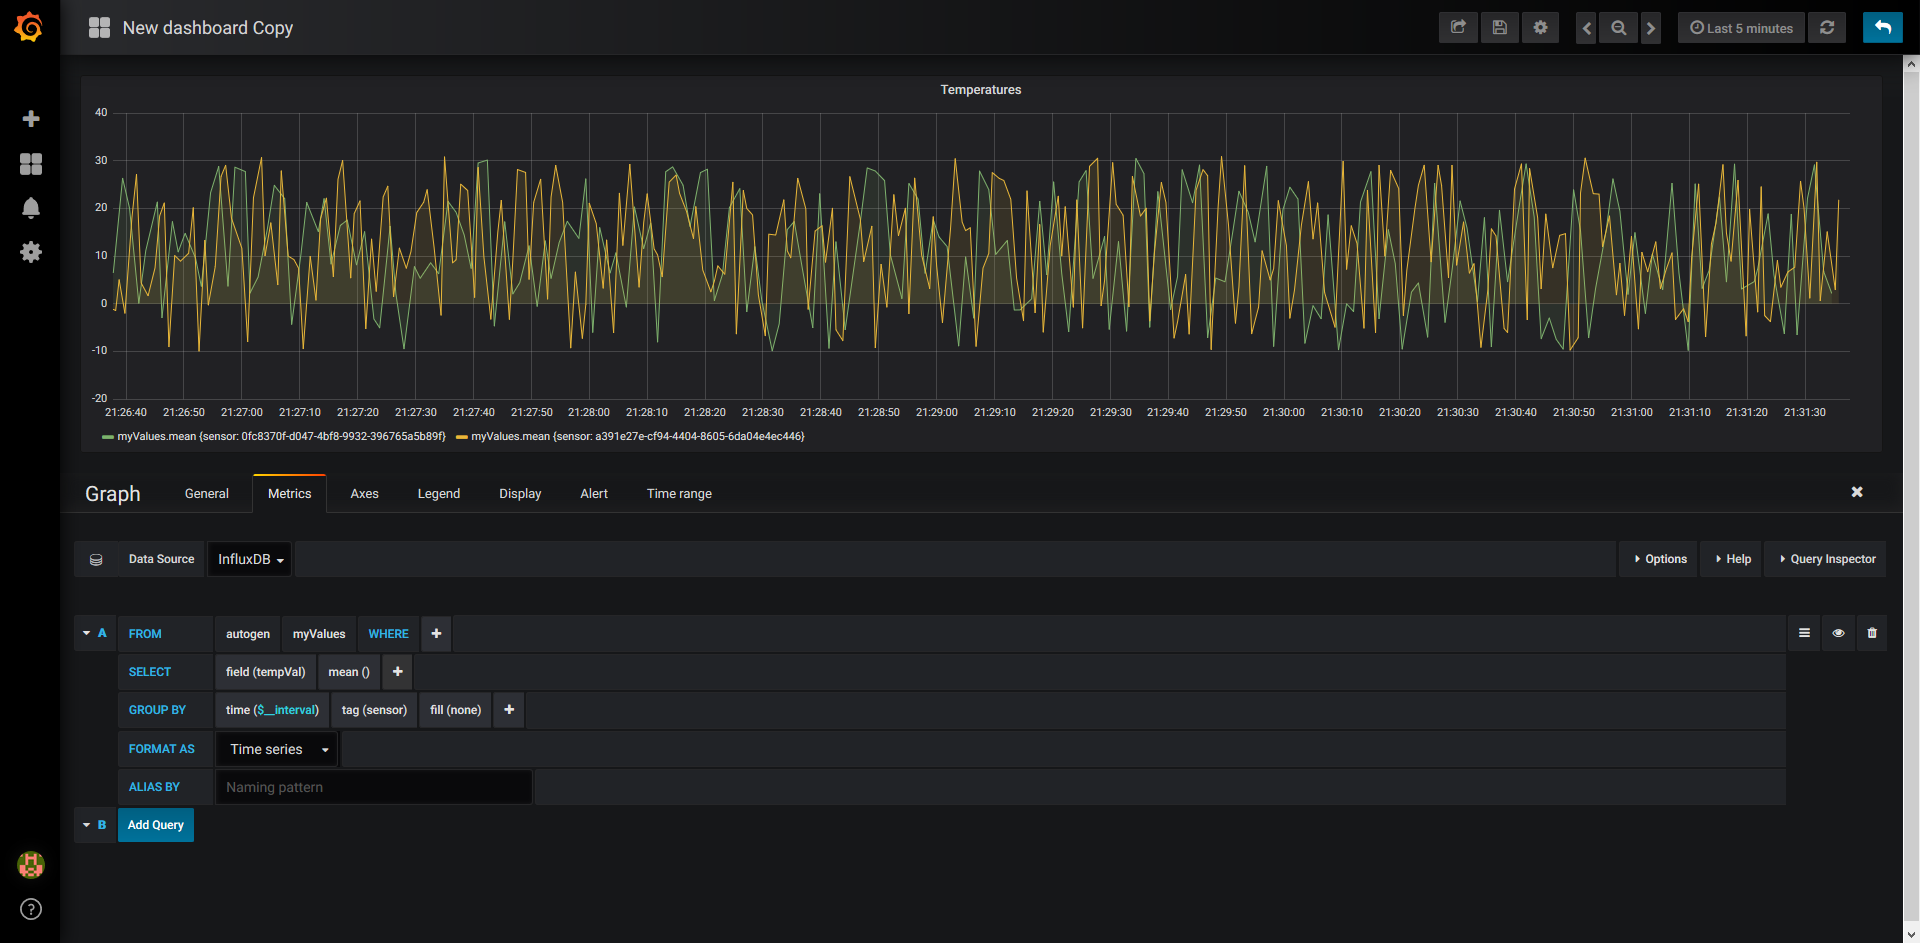
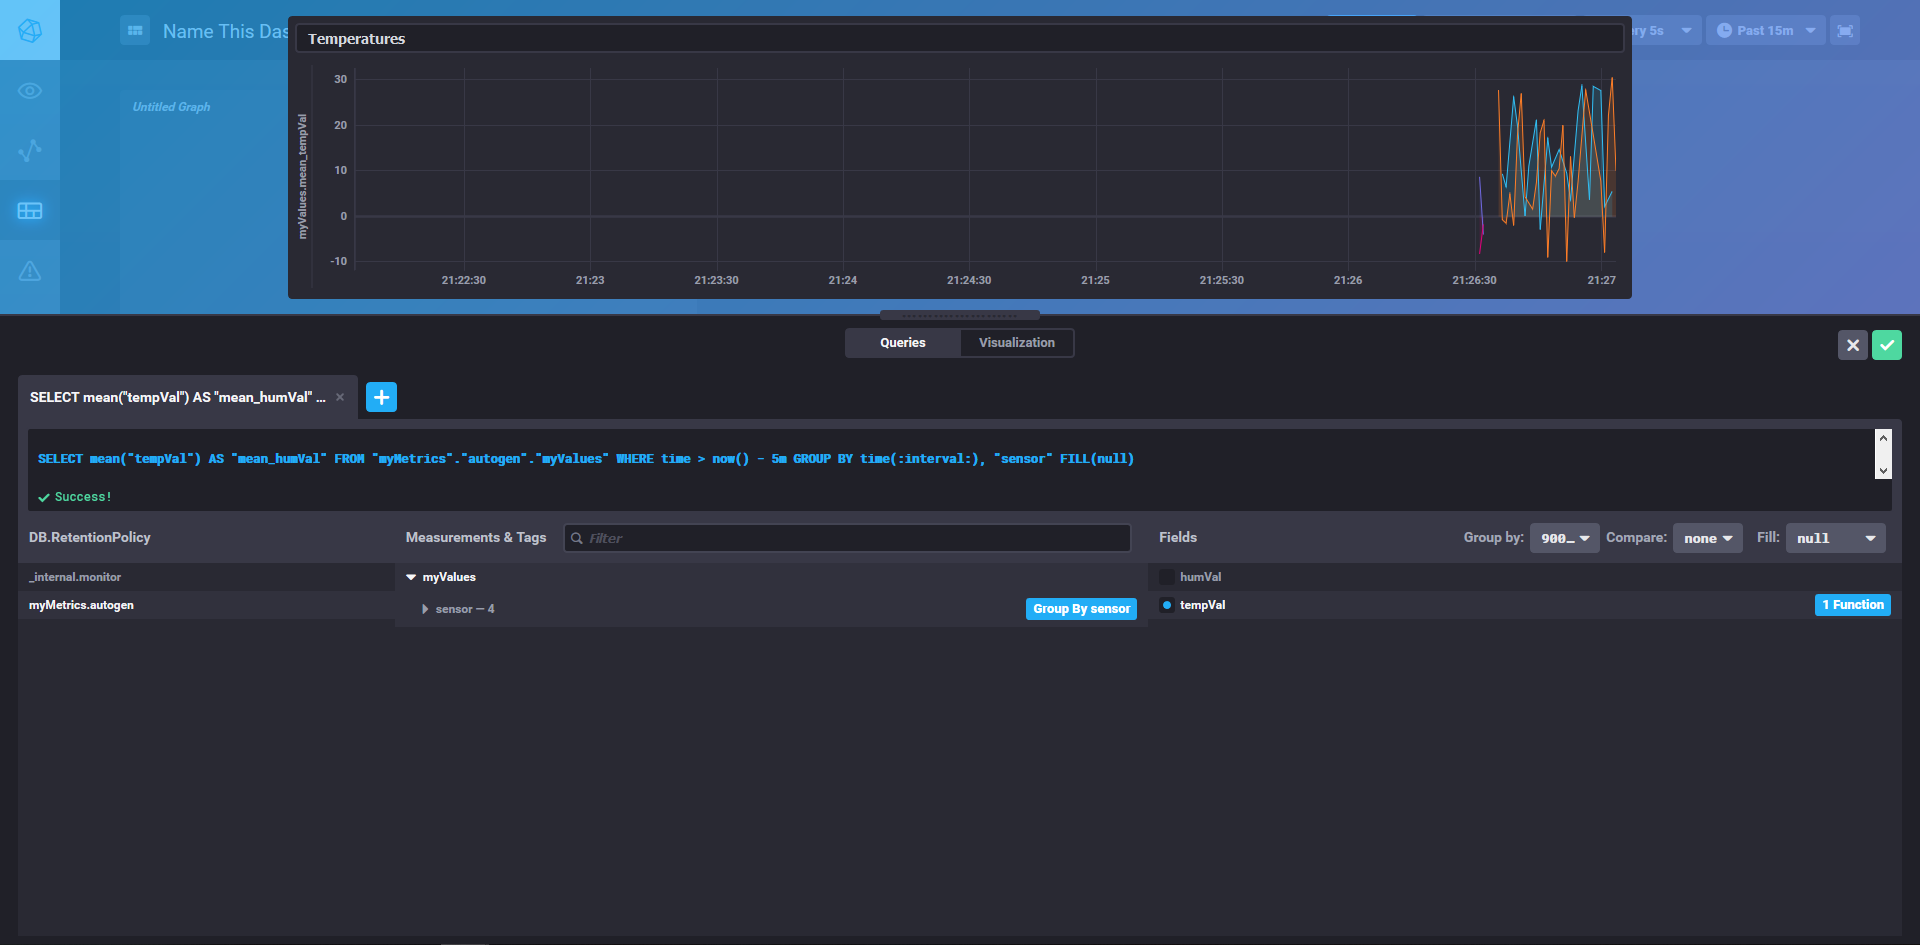
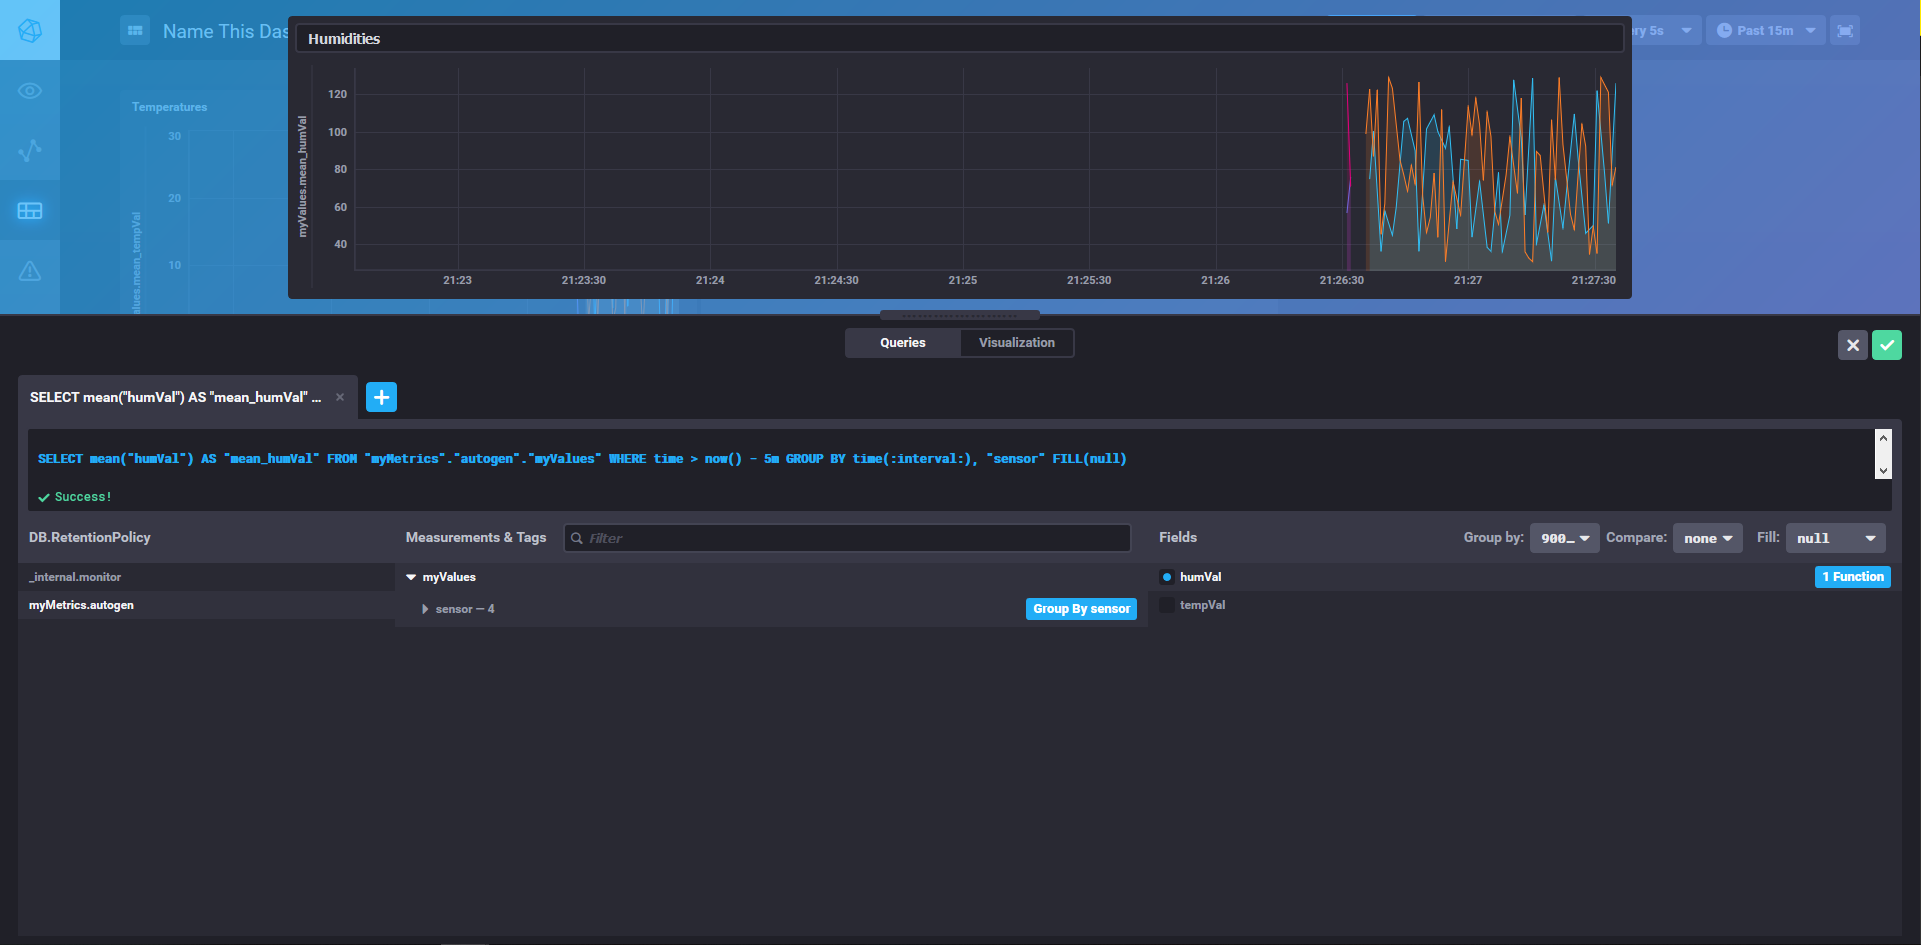
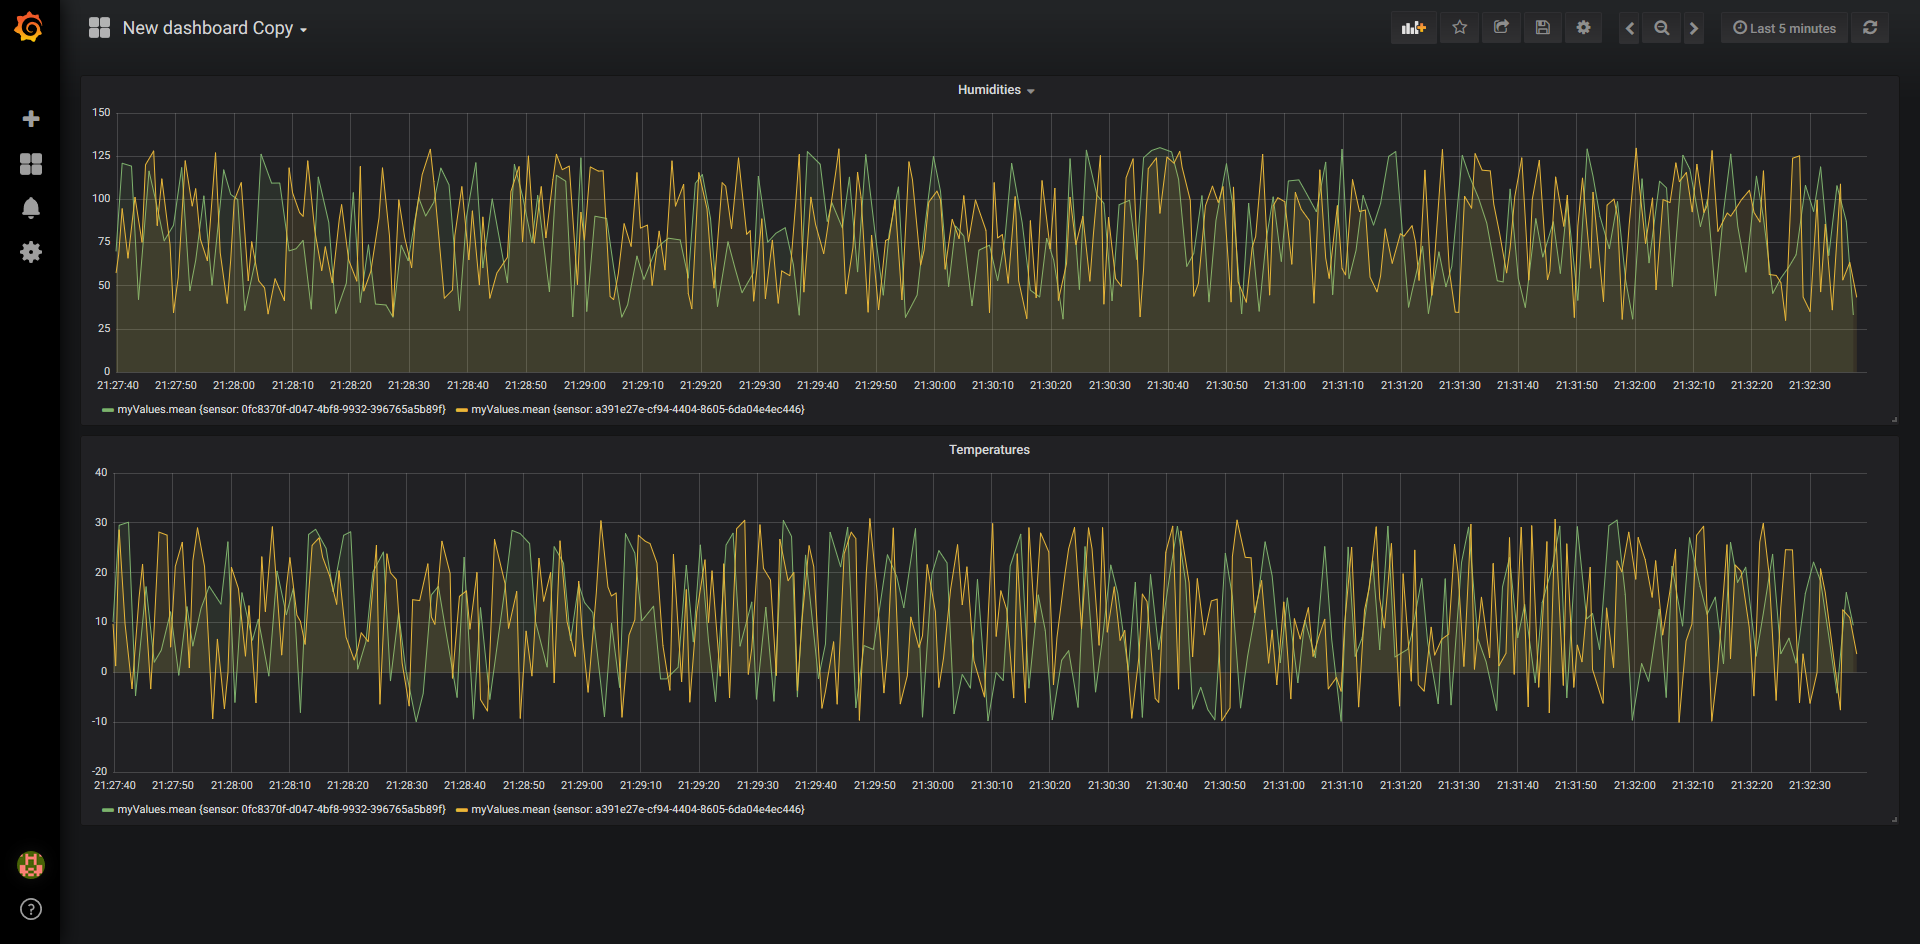
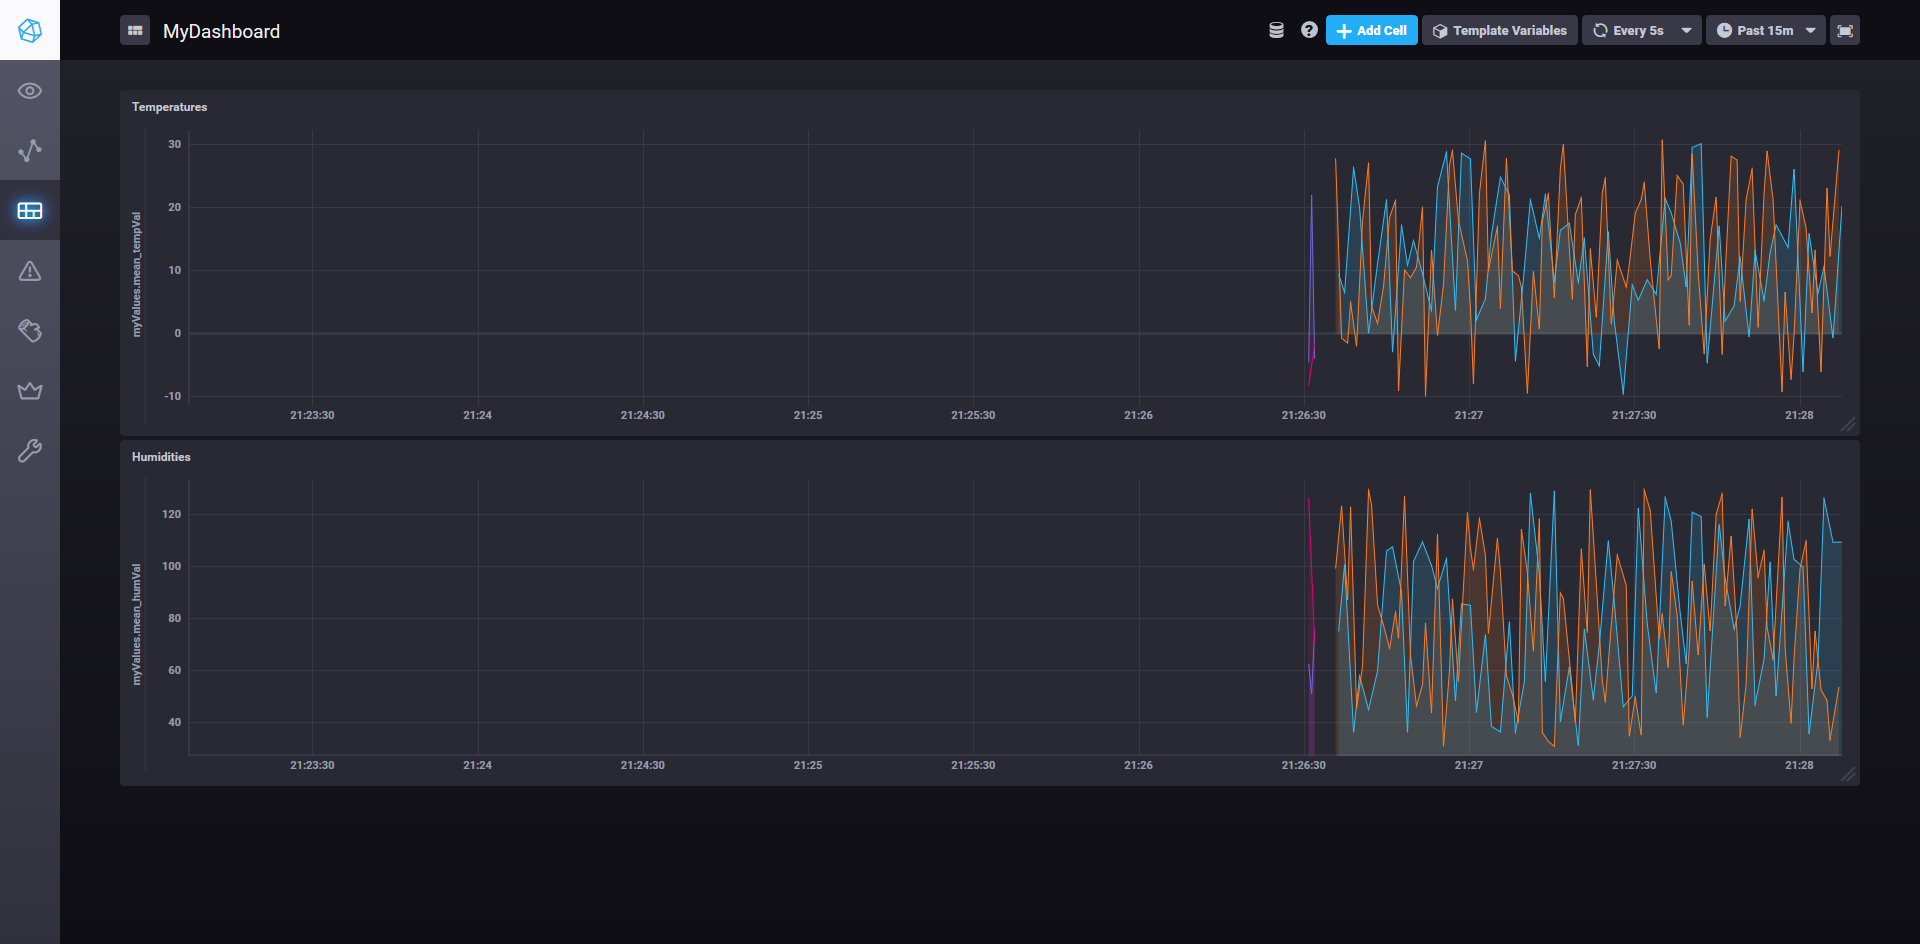
We now have our stream running that is sending everything to our InfluxDB. Once we manipulate our dashboards a little bit, we can set them up like this:
Grafana

Chronograf
Conclusion
Once all of this is done, we can view our completed dashboard and have a result that looks like this:
EventHub Sender Script
As a last point, I would like to include the script that I used to send mock data towards my EventHub:
const eventHubClient = require('azure-event-hubs').Client;
const config = require('./config.js');

// Init Client
const client = eventHubClient.fromConnectionString(config.getConnectionString(), config.eventHub);

// Create a sender
client.createSender()
.then((tx) => {
  setInterval(() => {
    const val = {
      temperature_sensor: {
        id: `sensor_${Math.floor((Math.random() * 10) + 1)}`,
        value: ((Math.random() * 41) - 10).toFixed(2),
        createdAt: new Date()
      },
      temp_value: ((Math.random() * 41) - 10).toFixed(2),
    };

    tx.send(val);
    console.log(`Sent: ${JSON.stringify(val)}`);
  }, 1000);
})
with the config containing
const config = {
  eventHubUrl: "<your_url>", // no protocol included
  eventHubSharedAccessKeyName: "RootManageSharedAccessKey",
  eventHubSharedAccessKey: "<your_key>",
  // This is the EventHub name (go to eventhub -> Event Hubs -> <Names>)
  eventHub: "<your_eh>",
  eventHubPath: "<your_eh_namespace>",
};

module.exports = {
  ...config,
  getConnectionString: () => `Endpoint=sb://${config.eventHubUrl}/;SharedAccessKeyName=${config.eventHubSharedAccessKeyName};SharedAccessKey=${config.eventHubSharedAccessKey}`
}


Comments ()